DeFi Coin Price Prediction: DEFC/USD Would Break Above $0.30
Estimated Reading Time: 3 minutes
Don’t invest unless you’re prepared to lose all the money you invest. This is a high-risk investment and you are unlikely to be protected if something goes wrong. Take 2 minutes to learn more

Free Crypto Signals Channel
 Free Telegram Channel
The DeFi Coin price prediction drops to touch the daily low of $0.30 as the price could dip for new buyers to surface.
DEFC/USD Medium-term Trend: Ranging (4H Chart)
Key Levels:
Resistance levels: $0.38, $0.40, $0.42
Support levels: $0.25, $0.23, $0.21
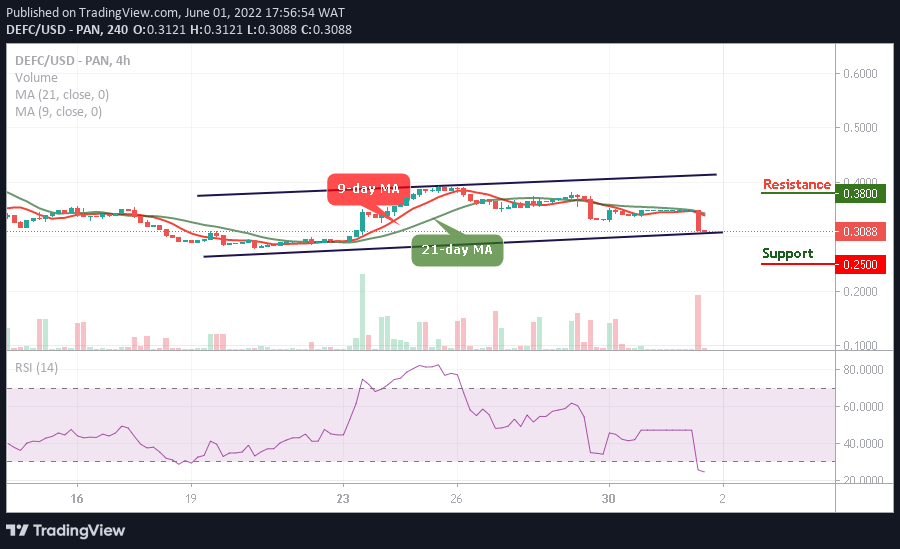
DEFC/USD is trading around $0.30 after the coin moves near the lower boundary of the channel. Looking at the chart, the buyers are getting ready to grab the DeFi Coin (DEFC) and push it to cross above the 9-day and 21-day moving averages. Meanwhile, if the sellers bring the market further lower once again, more buyers are expected to buy the dip.
DeFi Coin Price Prediction: Buyers Ready to take DEFC to the Upside
The DeFi Coin price will retrace back to the upside, buyers and new investors should watch for the next bearish signals for them to buy the dips. The DEFC price can fall slightly if the technical indicator Relative Strength Index (14) remains within the oversold region but the good thing is that it will from there spike to the upside. Though, any further supports could be located at $0.25, $0.23, and $0.21.
However, should the buyers hold the current support of $0.30 and climb higher; the bulls can expect immediate resistance to be located at $0.35. Any further bullish movement above the moving averages will hit the resistance levels of $0.38, $0.40, and $0.42.
DEFC/USD Medium-term Trend: Bearish (2H Chart)
On the 2-hour chart, the DeFi Coin price may cross below the channel, but if this occurs, this may allow new buyers to enter the market. Nevertheless, the existing buyers are also expected to buy any dip as the market gathers momentum to begin another bullish movement.
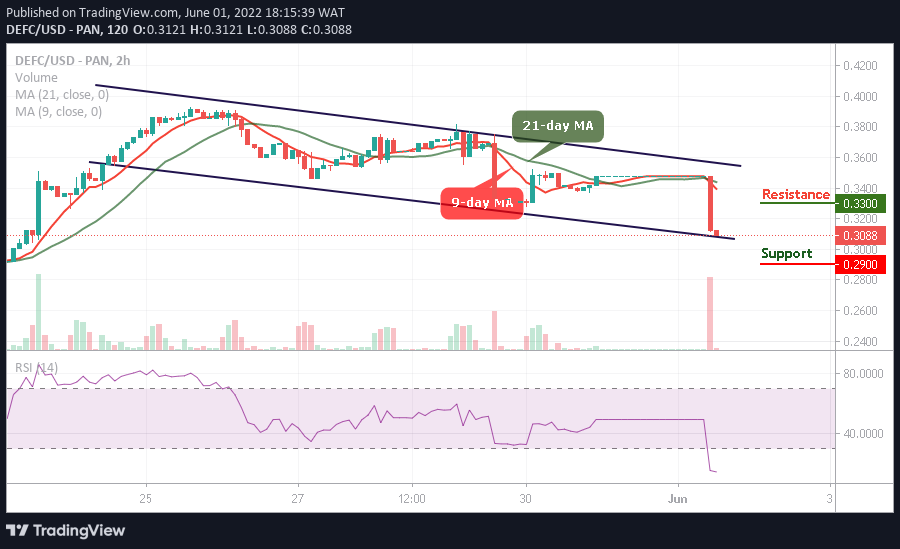
From above, if the buyers push the price back above the 9-day and 21-day moving averages, higher resistance could be found at $0.33 and above. Moreover, should the coin retreats below the channel, another support may come at $0.29 and below while the Relative Strength Index (14) stays within the oversold region preparing for an upward movement.
You can purchase DeFi Coin here. Buy DEFC