Berachain (BERA/USDT) Price Holds Critical $0.56 Zone as Bears Retain Medium-Term Control
Estimated Reading Time: 3 minutes
Don’t invest unless you’re prepared to lose all the money you invest. This is a high-risk investment and you are unlikely to be protected if something goes wrong. Take 2 minutes to learn more

The market for Berachain against Tether has extended its downward trend, falling 4.79% over the last 24 hours. This brings the current dip to a total of 15.13% seven-day drop as the pair performs lesser than the broader crypto market. As it stands, this decline has been attributed to the sharp contraction in decentralized finance activities, with total value locked plunging down about 95%. This strong development shows massive capital outflow, and it has severely affected the price movement from recording a meaningful rebound.
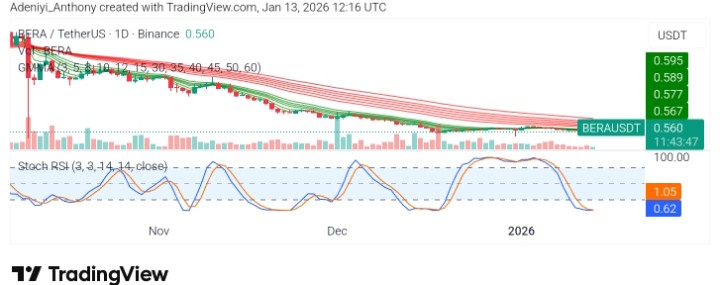
Currently, Berachain trades at $0.560 as the Guppy Multiple Moving Averages extend to the south.
Technical Indicators
Major Resistance Levels: $0.577, $0.589, and $0.595
Major Support Levels: $0.552, $0.540, and $0.500
Technical Analysis
Technically, Berachain against Tether on the daily timeframe has remained bearish. The price has been trading below a dense cluster of the GMMA.
This suggests that sellers seek to extend their dominance, as price action shows compression around the $0.56 region. This indicates that the market is attempting to stabilize after an extended decline rather than initiating a confirmed reversal.
From another angle, the volume seems to be relatively low, suggesting a lack of strong conviction from buyers at current levels. Meanwhile, the Stochastic RSI was observed to be turning down from mid-range levels, which was interpreted as fading bullish momentum rather than a fresh oversold bounce. To this end, the price has failed to reclaim the $0.577–$0.589 resistance band repeatedly. This further reinforces the view that upside attempts are still corrective in nature.
However, from a structural view, Berachain is attempting to form a lower high while defending the narrow support base. A close above $0.577 would expose the upper resistance levels even as the overall trend remains bearish
Update on Berachain
Despite a significant move by Bitcoin in recent times, Berachain has continued its extension to the south; it has been observed that the token’s sellers outweigh its buyers. As it stands, expectations about token release in the future may also lead to increased sell pressure. However, it is also likely that the token would bounce from where it is to around $1.4 or $1.6, but immediate resistance has to be broken with improved buying volume.
BERA/USDT Analysis: Short-Term Oversold Signals Hint at Relief Bounce
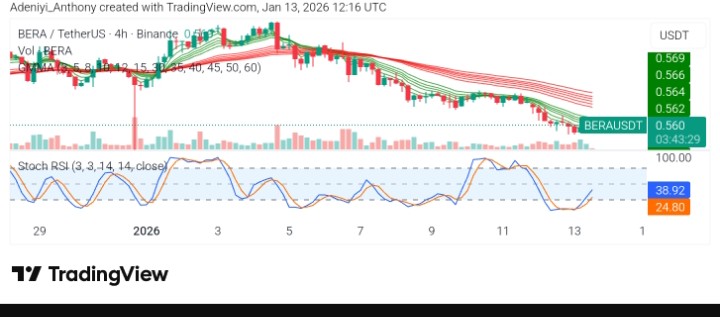
On the 4-hour chart, BERA/USDT was reported to be trading both the short- and long-term GMMA bands below, confirming alignment with the daily bearish bias. However, the tighter spacing of the moving averages was noted as a sign of dropping selling momentum. Meanwhile, the Stochastic RSI on the 4h timeframe was observed to be recovering from oversold territory, indicating an early signal of a possible short-lived relief bounce.
To this end, price reactions around $0.564 and $0.569 would determine and establish a potential upside. However, caution regarding daily momentum is warranted unless daily resistance is broken.
You can purchase crypto coins here. Buy Crypto