Berachain (BERA/USD) Sees Growing Interest, But Bullish Momentum Remains Subdued
Estimated Reading Time: 3 minutes
Don’t invest unless you’re prepared to lose all the money you invest. This is a high-risk investment and you are unlikely to be protected if something goes wrong. Take 2 minutes to learn more
In the current trading session, the Berachain (BERA/USD) market has experienced a notable surge in trading volume. However, much of this activity reflects conflicting sentiment, with buying and selling pressures colliding. This ongoing tug-of-war has kept price action relatively restrained.
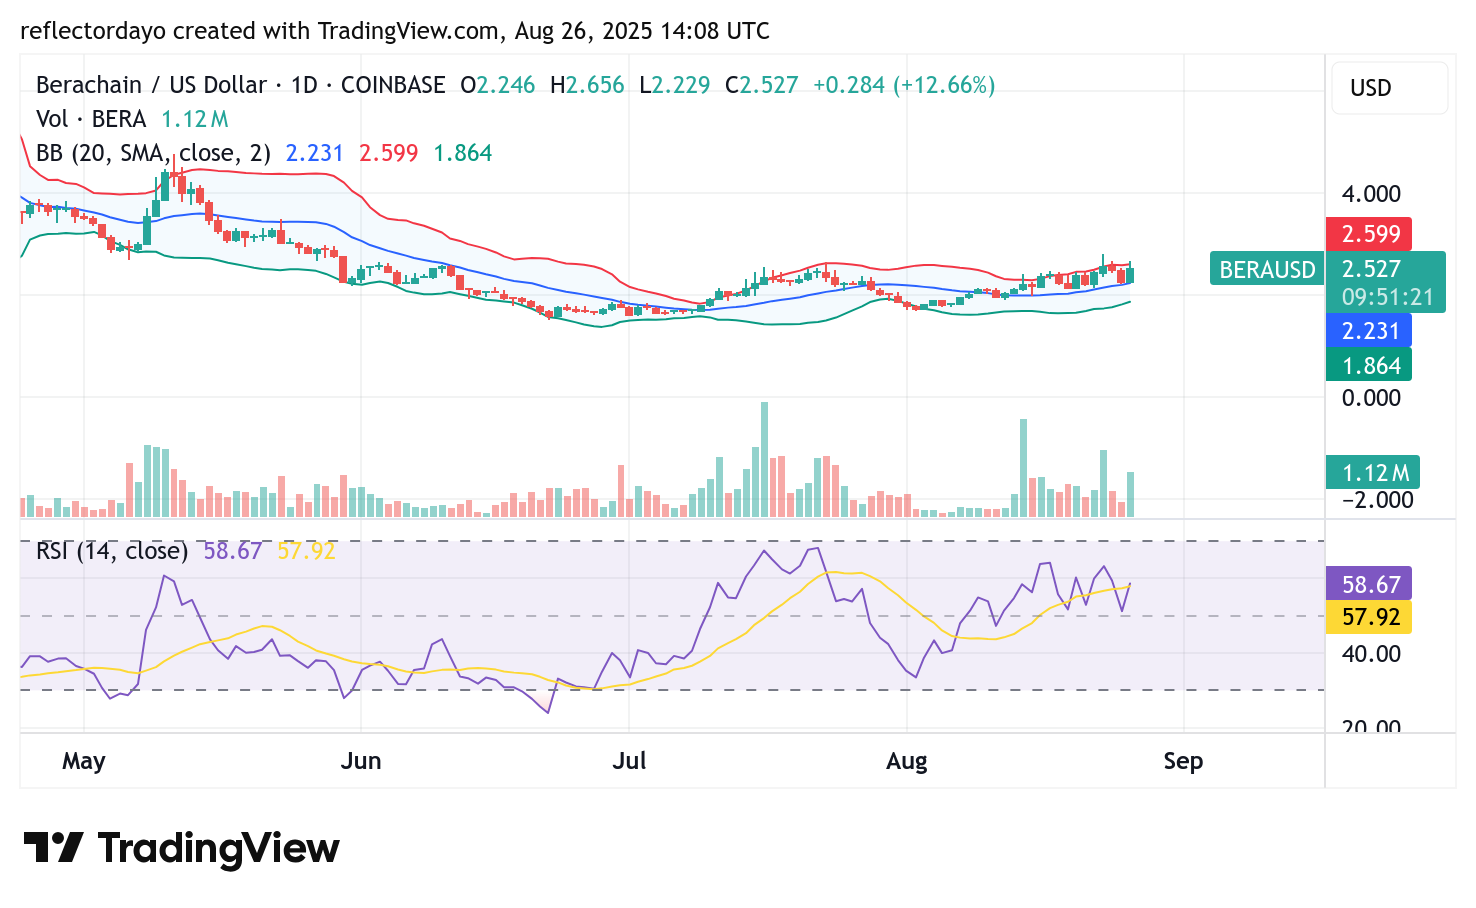
After opening at $2.23, BERA has moved only marginally, suggesting that neither buyers nor sellers have established clear dominance. With momentum appearing indecisive, it’s worth turning to the indicators for further insight into where the market may be heading next.
Berachain (BERA/USD) Market Data
- BERA/USD Price Now: $2.53
- BERA/USD Market Cap: $6.83 billion
- BERA/USD Circulating Supply: 33.6 billion BERA
- BERA/USD Total Supply: 97.5 billion BERA
- BERA/USD CoinMarketCap Ranking: #23
Key Levels
- Resistance: $2.80, $3.00, and $3.20.
- Support: $2.10, $2.00, and $1.90
Daily Chart Outlook: BERA/USD Shows Signs of Consolidation
Analyzing Berachain (BERA/USD) from the daily chart perspective, trading volume reveals that the peaks of the histogram bars are gradually descending. This suggests that the initial bullish momentum among traders may be losing strength, paving the way for potential consolidation around the $2.50 level.
Adding weight to this outlook, the RSI is hovering near 58, reflecting a cautious bullish sentiment. While today’s price action shows modest upward movement, the crypto signal remains confined within a narrow channel. Resistance at $2.60 has yet to be broken, while bulls have consistently defended support at $2.23. Until either boundary gives way, BERA is likely to continue trading within this tight range.

4-Hour Chart Outlook: BERA/USD Consolidation Gains Momentum
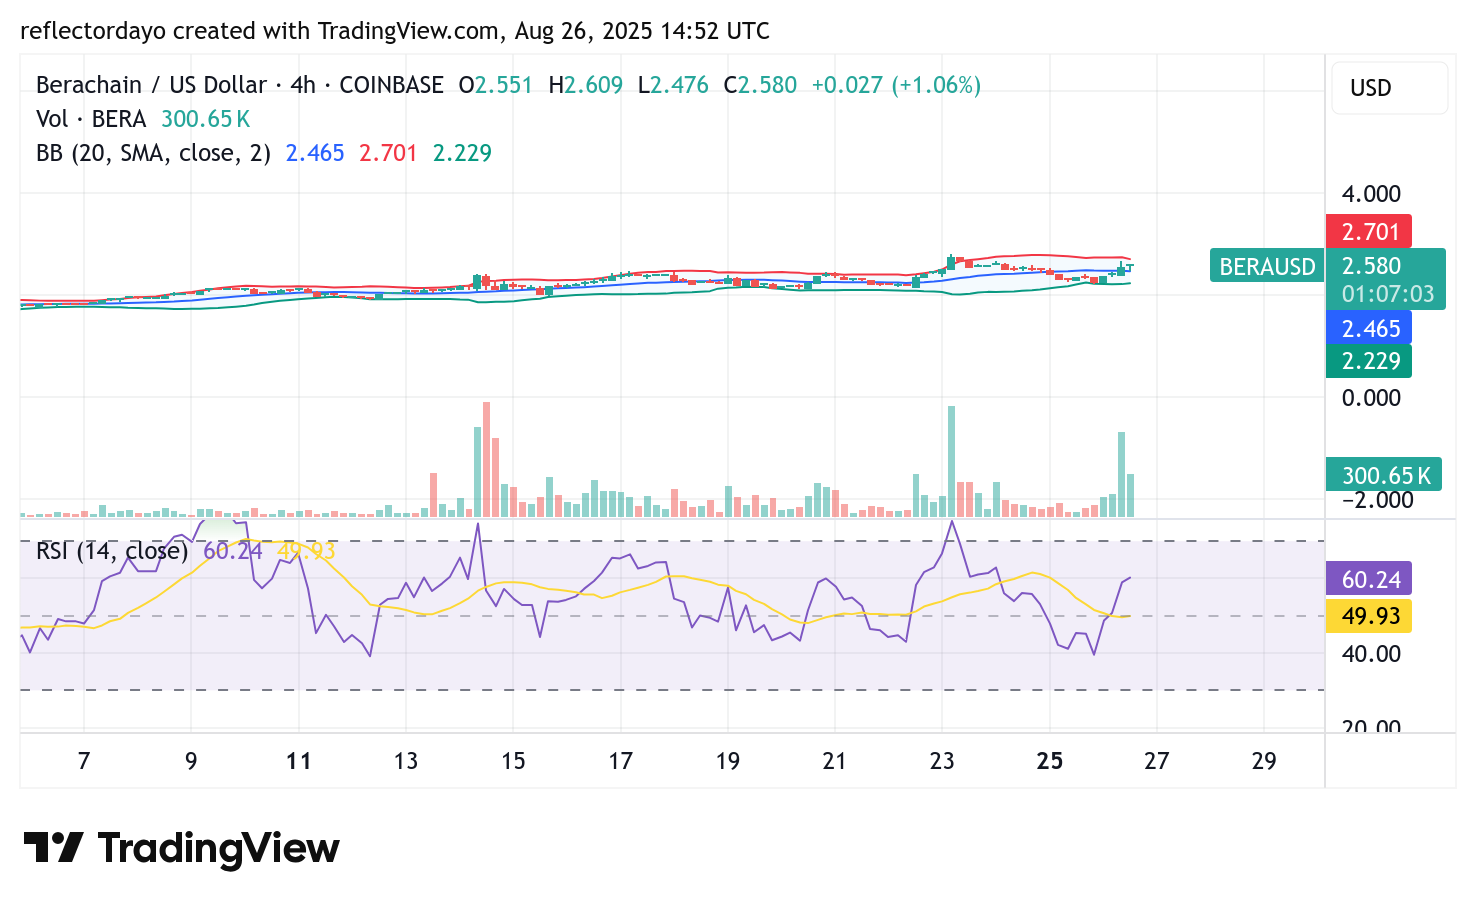
On the 4-hour chart, BERA/USD is displaying clearer signs of consolidation. The previous trading session recorded a notable increase in trading volume, yet this failed to translate into significant bullish price movement. In the current session, the appearance of a plus-sign doji highlights growing indecision in the market, as buyers and sellers remain locked in a stalemate.
This tug-of-war is reinforcing the consolidation pattern, with price action likely to remain confined within the existing narrow channel until a breakout occurs.