Litecoin (LTC/USD) Price Is Bargaining Around $80
Estimated Reading Time: 3 minutes
Don’t invest unless you’re prepared to lose all the money you invest. This is a high-risk investment and you are unlikely to be protected if something goes wrong. Take 2 minutes to learn more
Litecoin Price Prediction – December 6
The LTC/USD price is bargaining around the $80 trading line as there has been a chain of higher0low signs on the crypto market operations. The trading environment has stabilized to a minimal negative of 0.62 percent, or about $79.68 point.
LTC/USD Market
Key Levels:
Resistance levels: $85, $90, $95
Support levels: $70, $65, $60
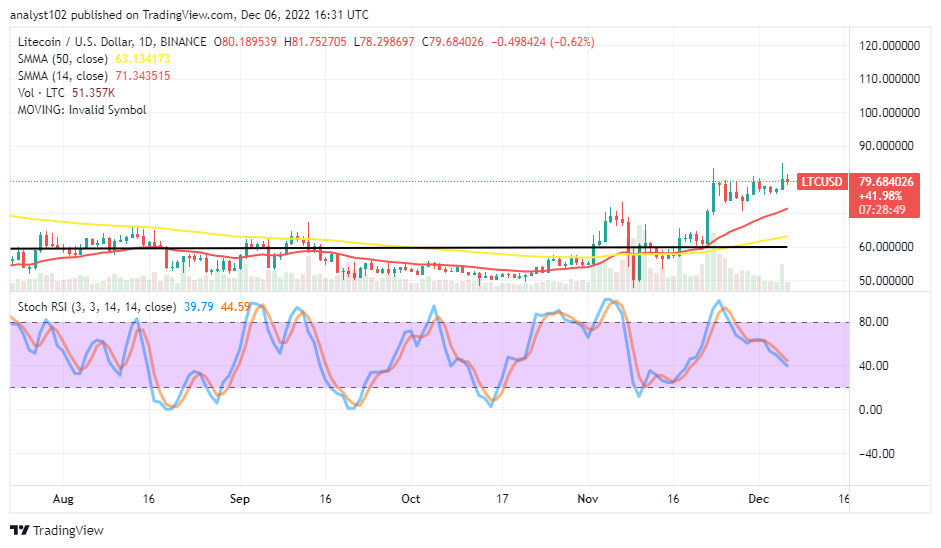
LTC/USD – Daily Chart
The LTC/USD daily chart mirrors that the crypto’s price is bargaining around the $80 trading level, serving as a firmer-resistance trading spot to determine a definite direction to either further ups or to return to a falling moment. The 14-day SMA indicator is at $71.343515 points over the $63.134173 value line of the 50-day SMA indicator. The Stochastic Oscillators have bent southbound from the overbought region to place at 44.59 and 39.79 levels.
What direction does the LTC/USD market currently have in mind?
The LTC/USD market operation holds a more buying-forcing outlook than freely succumbing to a falling trend in the near time as the price is bargaining around the $80 trading zone. In the wake of necessary retracement, the market will need to go down to rebuild its journey back to the upside from around the trend line of the 14-day SMA. Buyers will have better insight into when to execute a longing order, taking the reading of the Stochastic Oscillators’ positioning into consideration at lower range spots giving a northbound-crossing mode.
According to the downside technical analysis, before the price can reject to generate a sell signal, the LTC/USD market must first swing northward through some resistances below $95. When the smaller SMA crosses a high-resistance trading point in a downward direction, shorting opportunities will result, especially if a bearish candlestick forms to engulf some penultimate bullish candlesticks in the process.
LTC/BTC Price Analysis
In comparison, Litecoin appears to still hold firmer against the trending ability of Bitcoin over the buying signal side of the SMA trend lines. The bullish trend line slightly drew northward over the 14-day SMA indicator and is above the 50-day SMA indicator. The Stochastic Oscillators have dipped into the oversold region, trying to cross northbound at 7.46 and 13.58 levels. Even though the base crypto has a strong velocity advantage, longing tendencies should cautiously check.
Note: Cryptosignals.org is not a financial advisor. Do your research before investing your funds in any financial asset or presented product or event. We are not responsible for your investing results
You can purchase Lucky Block here. Buy LBLOCK