Solana (SOL/USD) Price May Hold a Depression Succession Soon
Estimated Reading Time: 3 minutes
Don’t invest unless you’re prepared to lose all the money you invest. This is a high-risk investment and you are unlikely to be protected if something goes wrong. Take 2 minutes to learn more
Solana Price Prediction – January 6
The SOL/USD price may hold a depression succession soon below the $15 resistance line. There has been less difference between the high and the low values as the market trades around $13.12 at a 2.31 percent rate negative.
SOL/USD Market
Key Levels:
Resistance levels: $15, $17.50, $20
Support levels: $10, $7.50, $5
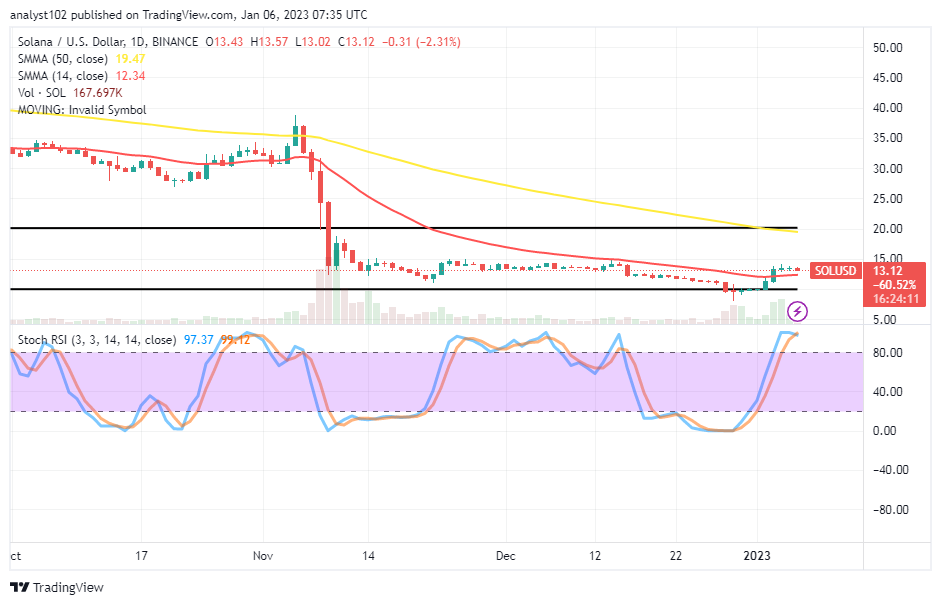
SOL/USD – Daily Chart
The SOL/USD daily chart reveals the crypto-economic price may hold a depression succession soon as there has been a line of rejection in the motion to the upside below the $15 resistance level. The 14-day SMA indicator is at the $12.34 value line beneath the value line of the $19.47 point of the 50-day SMA indicator. The Stochastic Oscillators have reached 99.12 and 97.37 levels. That implies bullish pressures are in a higher-decreasing mode.
Will the SOL/USD market make an effort to push through the $15 resistance line and move higher?
The SOL/USD market bulls will not be able to make efforts to go through the $15 resistance point as the crypto’s price may hold a depression succession soon beneath the value. Long-position placers may still feature closely over the trend line of the 14-day SMA indicator to prolong a stay. An active move to the north will summarily produce a whipsawed condition against buyers.
On the downside of the technical analysis, sellers are seemingly trying to make a resistance stance around the $15 level. It is that the price will hold firmer, positively opposing further upward forces. Execution of the selling order will prevail when a bearish candlestick emerges after a line of convergence closely over the trending arena of the 14-day SMA. Under a setting of consolidation-moving style at the current trading capacity, the price likely will be liable to making false upside motions.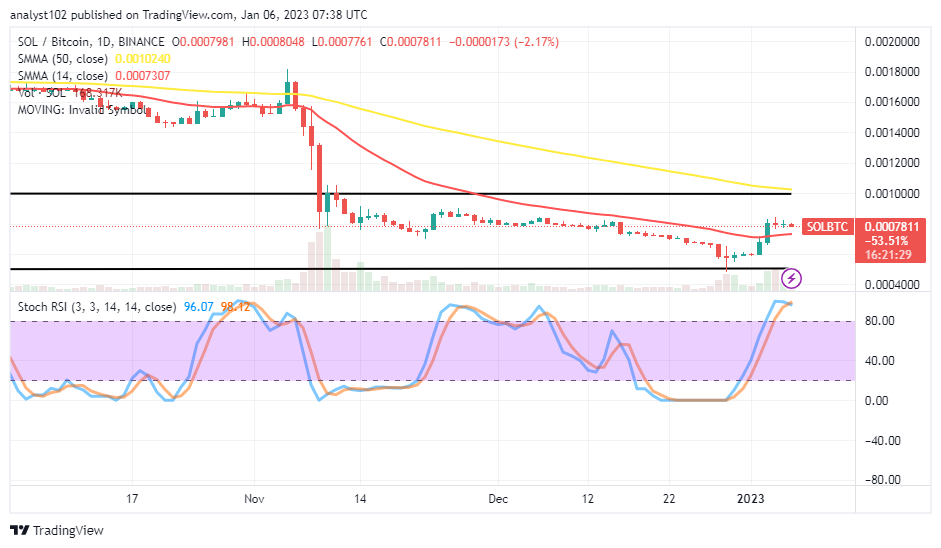
SOL/BTC Price Analysis
Solana has muscled up to completion in a rallying motion against the trending ability of Bitcoin. The 14-day SMA indicator is underneath the trend line of the 50-day SMA indicator. The upper and the lower horizontal lines drew to keep the face of the range-bound spots that the market has been over time. The Stochastic Oscillators are at 98.12 and 96.07 levels, indicating that the base cryptocurrency may succumb to a debase-moving manner in the ensuing transactions.
Note: Cryptosignals.org is not a financial advisor. Do your research before investing your funds in any financial asset or presented product or event. We are not responsible for your investing results.
You can purchase Lucky Block here. Buy LBLOCK