UMA (UMAUSD) Is Being Blocked From Completing a Bullish Resurgence
Estimated Reading Time: 2 minutes
Don’t invest unless you’re prepared to lose all the money you invest. This is a high-risk investment and you are unlikely to be protected if something goes wrong. Take 2 minutes to learn more
UMA Analysis – The Market Is Being Blocked From Making a Bullish Revival
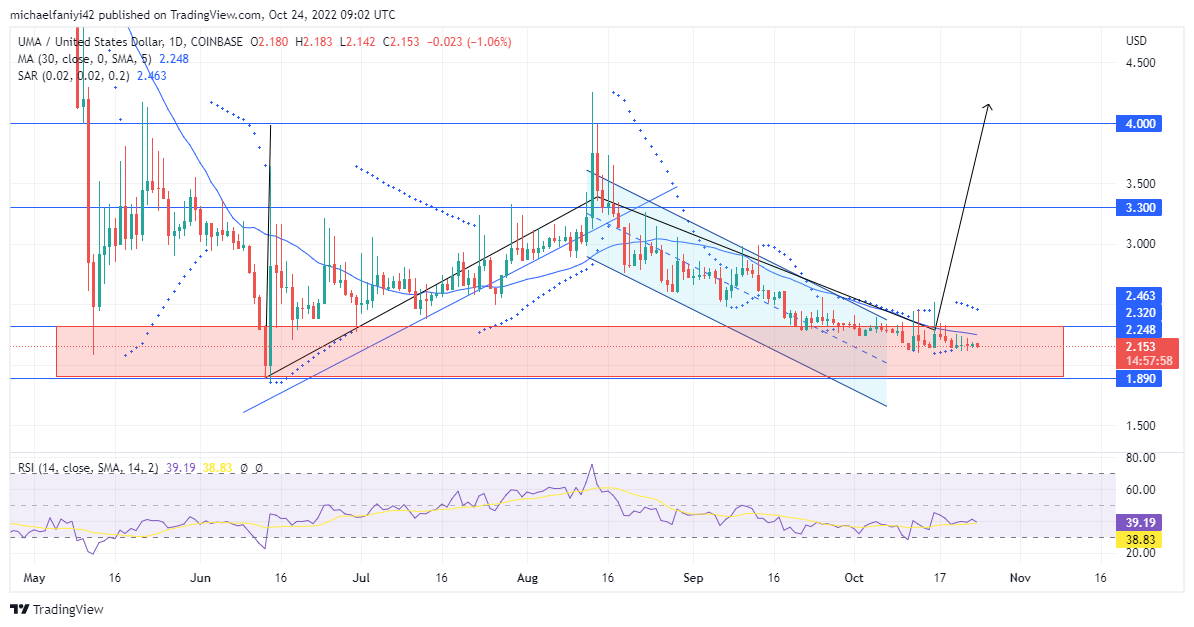
UMA is being blocked from making a bullish resurgence from below the $2.320 price level. A depleted buying base got stuck below the $3.300 resistance level for a long period. There was a time, however, when their persistence made headway, and that was in mid-August. That rally was short-lived and the price soon drop back, even below $2.320 where it initially rose from, and so far, the coin has been further blocked from making a comeback of any sort.
UMAUSD Important Levels
Resistance Levels: $4.000, $3.300, $2.320
Support Levels: $1.890, $1.200, $1.000
The sellers brought the market below $2.320 for the first time this year on the 12th of May. Since then, UMA hasn’t been able to regain the heights it fell from. The highest it could attain was a little past $4.000 which did not last long. However. that brief rise to $4.000 and the drop back below $2.320 form the price of a potential double-bottom bullish reversal structure. A rise back to $4.000 will help to break market bearishness.
Nevertheless, the buyers have been thus far stifled in their plan to push the price higher from below the $2.320 critical level. It could still happen, but the bulls face an uphill task. The Parabolic SAR (Stop and Reverse) with small alternating dots around the daily candlesticks shows that the price isn’t having a strong direction of movement currently.
Market Expectation
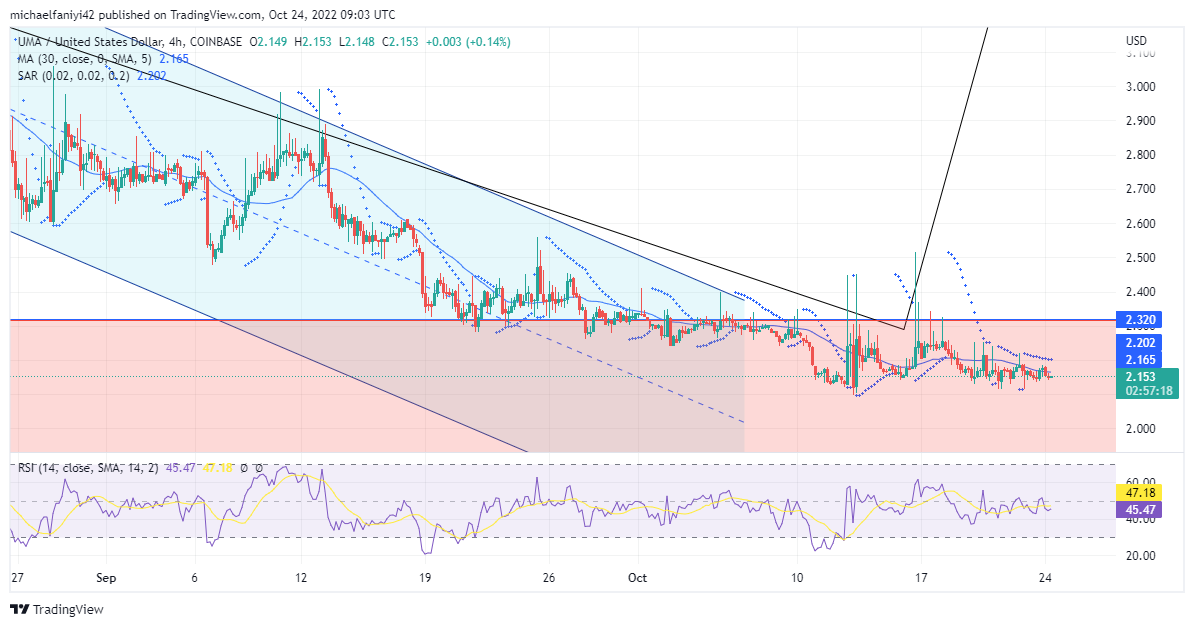
On the daily chart, the RSI (Relative Strength Index) line is in the bearish half, which shows the influence of the sellers, but it isn’t in the oversold region, which means the price still has more scope to be under the bearish influence. This is similar to the 4-hour chart, whose line is even closer to the midway line. The Parabolic SAR dots are also alternating around the 4-hour candles, with more aligning above the candles.
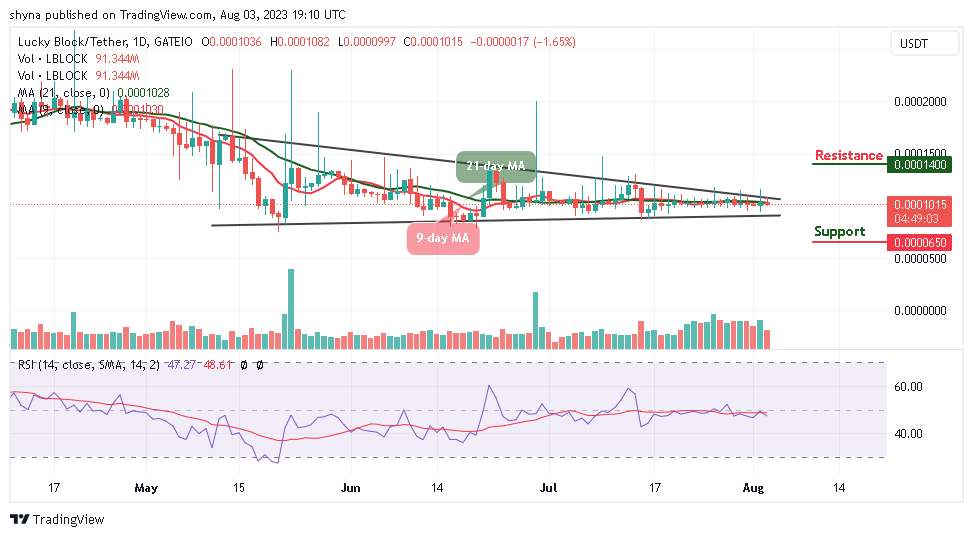
You can purchase Lucky Block here. Buy LBLOCK
Note: Cryptosignals.org is not a financial advisor. Do your research before investing your funds in any financial asset or presented product or event. We are not responsible for your investing results.