Lucky Block Price Prediction: LBLOCK/USD is Extremely Cheap for Buyers
Estimated Reading Time: 3 minutes
Don’t invest unless you’re prepared to lose all the money you invest. This is a high-risk investment and you are unlikely to be protected if something goes wrong. Take 2 minutes to learn more

Free Crypto Signals Channel
The Lucky Block price prediction remains below the moving averages as more buyers are expected to come into the market soon.
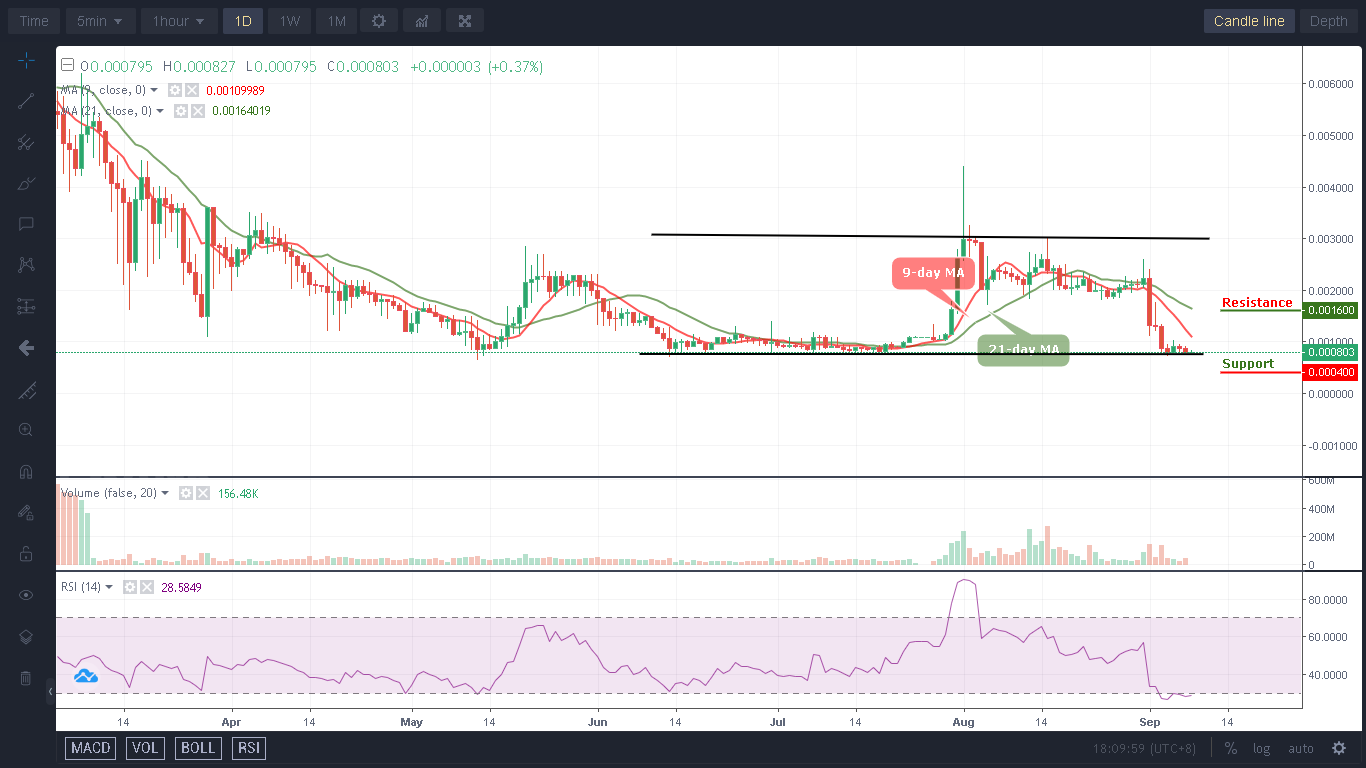
LBLOCK/USD Medium-term Trend: Ranging (1D Chart)
Key Levels:
Resistance levels: $0.0016, $0.0018, $0.0020
Support levels: $0.0004, $0.0003, $0.0002
Looking at the daily chart, LBLOCK/USD is trading under the 9-day and 21-day moving averages, this is for the market price to prepare for another bullish movement. The buyers are gathering momentum for the new investors to come into the market.
Lucky Block Price Prediction: LBLOCK/USD Will Pump Furiously
As soon as the 9-day moving average break above the 21-day moving average, the Lucky Block price will head to the upside, any further bullish movement above will push the Lucky Block price to the resistance levels of $0.0016, $0.0018, and $0.0020.
Nevertheless, the market can become very cheap if the bears move the coin below the lower boundary of the channel, sliding to the negative side can cause the coin to hit the supports at $0.0004, $0.0003, and $0.0002. Meanwhile, the technical indicator Relative Strength Index (14) is moving within the oversold region to prepare the coin for upward movement.
LBLOCK/USD Medium-term Trend: Bearish (4H Chart)
On the 4-hour chart, the Lucky Block price is ready to break above the 9-day and 21-day moving averages. The long-term moving averages will keep the bullish movement as the market is starting a new trend in the next positive direction. Moreover, as soon as the buyers push the price above the upper boundary of the channel, a higher resistance level could be located at $0.0020 and above.
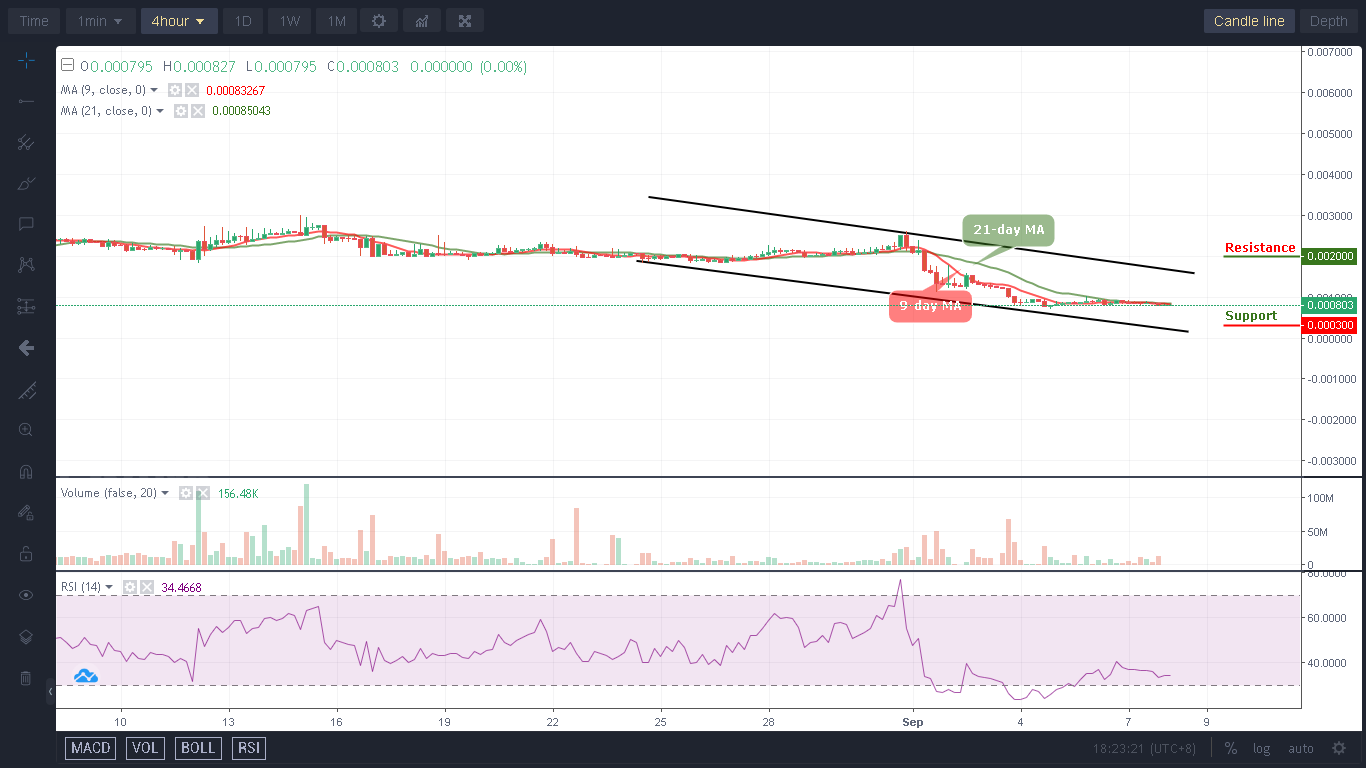
Meanwhile, the technical indicator Relative Strength Index (14) is moving below the 30-level, indicating that the coin may consolidate before moving higher. Should the bulls fail to move higher, sellers may step into the market, and the nearest support level could be located at $0.0003 and below.
You can purchase Lucky Block here. Buy LBLOCK