Pi Network Breaks to New Lows as Bearish Trend Deepens
Estimated Reading Time: 3 minutes
Don’t invest unless you’re prepared to lose all the money you invest. This is a high-risk investment and you are unlikely to be protected if something goes wrong. Take 2 minutes to learn more

PI/USD Price Analysis – Sellers Solidify Their Control as The Price breaks below a long-standing support level
Pi Network market has entered a new, more aggressive phase of its long-term downtrend after a breakdown below a critical support floor. The prolonged period of low-volatility consolidation has resolved to the downside, confirming that sellers are in absolute control of the price action. The asset is now trading at new lows, with technical indicators pointing to continued weakness.
Pi Network Key Levels
Support Levels: $0.3094, $0.5000
Resistance Levels: $0.4090, $0.7110

Pi Network Long-Term Trend: Bearish (Daily Chart)
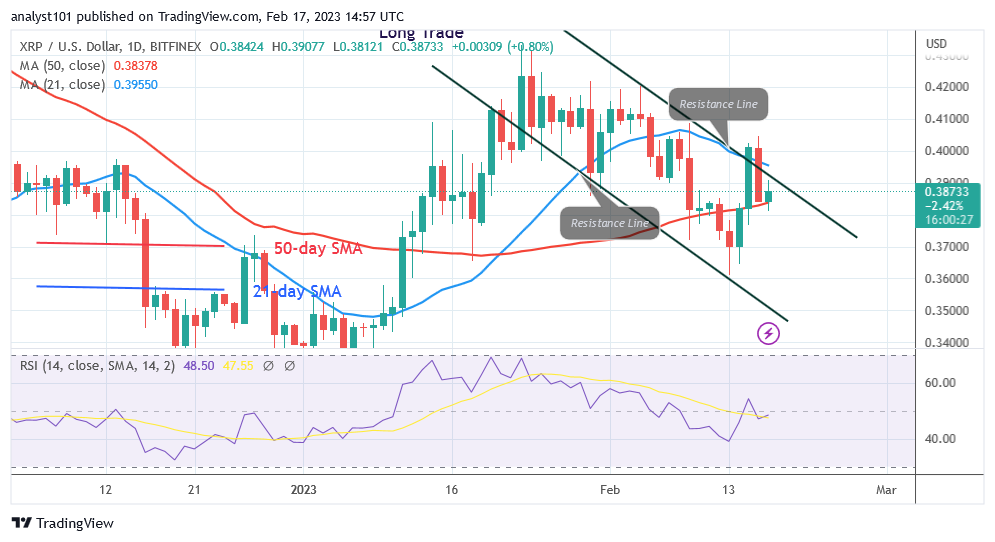
PI/USD illustrates a market in a strong and persistent downtrend. The multi-week consolidation phase that had offered some stability above the $0.4099 level has now failed. Sellers have successfully pushed the price below this key support, which now acts as a formidable resistance ceiling. This breakdown signals a continuation of the broader bearish trend that has been in place for most of the year.
The traders have opened the week at $0.3543, the asset is now exploring new bearish territory. With sellers clearly in command, the path of least resistance is to the downside. The next logical area of interest for support is around the $0.3094 mark. The overall outlook remains negative as long as the price stays below the recently broken $0.4099 level.
The Parabolic SAR dots are positioned well above the price candles, confirming the strength and direction of the downtrend. The Stochastic oscillator is deep in the oversold region at 16.08 / 17.17. This indicates that the selling pressure has been intense, and while it can sometimes lead to a pause, it first and foremost validates the overwhelming control held by the bears.

Market Expectation
Despite the current sideways movement, the short-term trend is unequivocally bearish. The price is consolidating well below its previous support level, and sellers remain in control. This consolidation is likely a temporary pause before the next potential move, and any minor rallies will likely be met with selling pressure from the overhead Parabolic SAR and horizontal resistance.
The Parabolic SAR dots remain above the price, confirming that the immediate trend is still bearish. The Stochastic oscillator, at 36.19 / 39.84, has moved up from its extreme oversold lows, which corresponds with the price going flat. However, it remains well below the neutral 50 level, indicating that the underlying momentum is still with the sellers.
You can purchase Lucky Block here. Buy LBLOCK
Note: Cryptosignals.org is not a financial advisor. Do your research before investing your funds in any financial asset or presented product or event. We are not responsible for your investing results