Cardano (ADA) Is in a Tight Range, Resumes Downward Correction
Estimated Reading Time: 2 minutes
Don’t invest unless you’re prepared to lose all the money you invest. This is a high-risk investment and you are unlikely to be protected if something goes wrong. Take 2 minutes to learn more
Cardano (ADA) Long-Term Analysis: Bearish
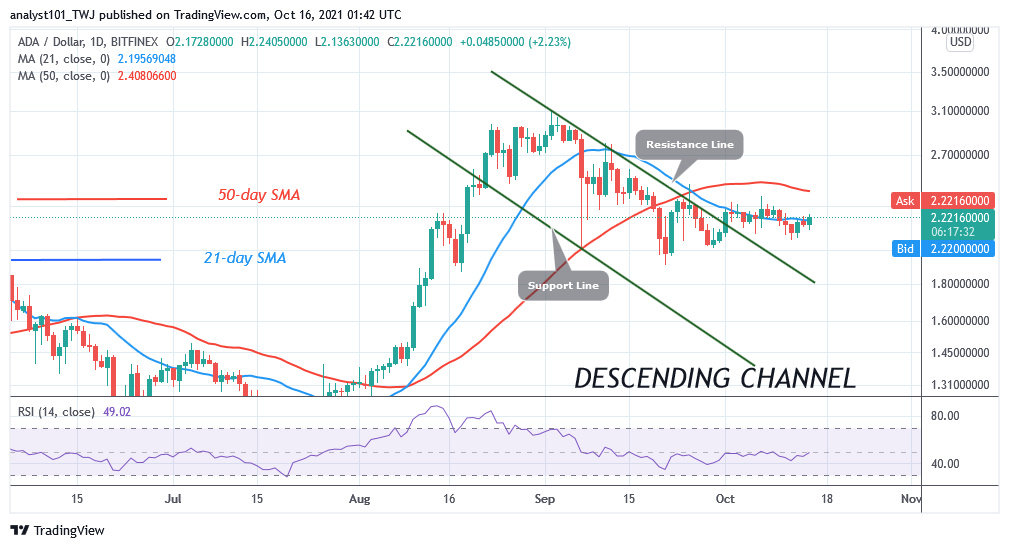
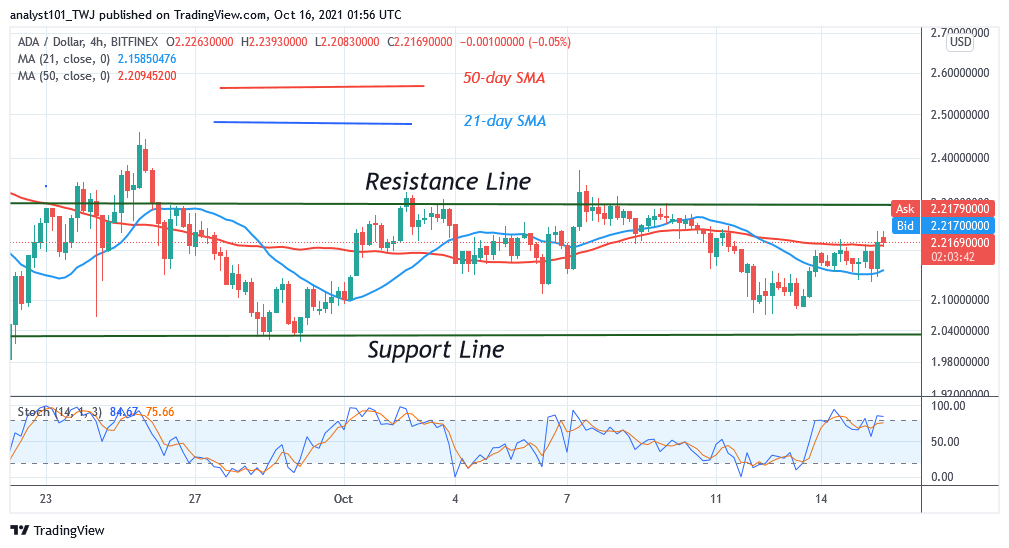
Cardano’s (ADA) price is in a downward correction as price breaks below the 21-day SMA. September 20, ADA price has been consolidating above the $ 2.00 support. The upward moves have been facing rejection at the high of $2.30. Presently, Cardano is trading marginally as the price action is characterized by small body candlesticks. These candlesticks are responsible for the current sideways movement. The candlesticks describe the indecision between buyers and sellers about the direction of the market. If buyers push the ADA above $2.60, the altcoin will resume an uptrend.
Cardano (ADA) Indicator Analysis
Cardano is at level 49 of the Relative Strength Index period 14. It indicates that there is a balance between supply and demand. The 21-day SMA and the 50-day SMA are sloping horizontally. The altcoin is above the 80% range of daily stochastic. The market is approaching the overbought region.
Technical indicators:
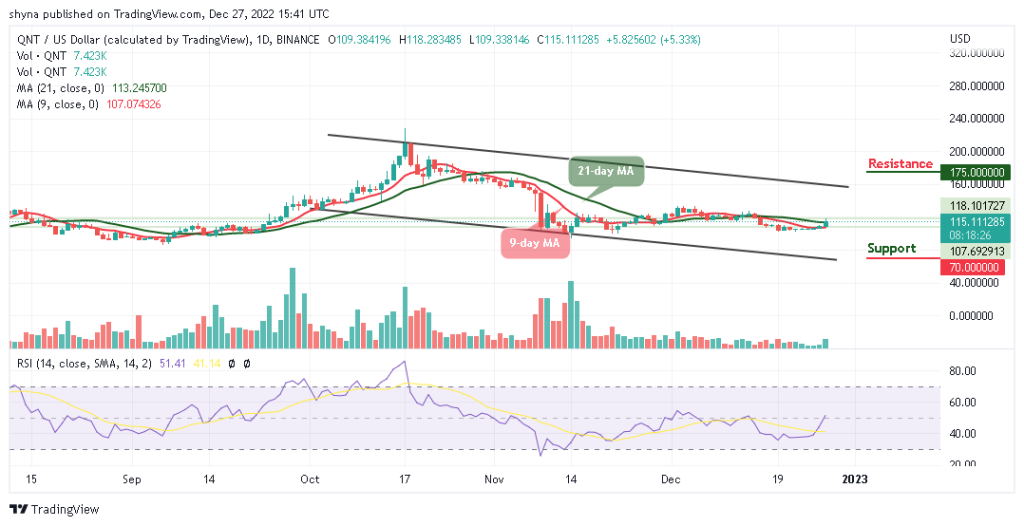
Major supply zones: $2.0, $2.20, $2.40
Major demand zones: $1.40, $1.20, $1.00
What Is the Next Direction for Cardano (ADA)?
ADA/USD is in a range-bound move. For the past month, the altcoin has been fluctuating between levels $2.00 and $2.30. Buyers and sellers are yet to break the range-bound levels. The crypto’s price is below the moving averages which indicate the market will decline.
You can purchase crypto coins here. Buy Token
Note: Cryptosignals.org is not a financial advisor. Do your research before investing your funds in any financial asset or presented product or event. We are not responsible for your investing results