Lucky Block Price Prediction: LBLOCK/USD Stays Around $0.0008; Time to Buy
Estimated Reading Time: 2 minutes
Don’t invest unless you’re prepared to lose all the money you invest. This is a high-risk investment and you are unlikely to be protected if something goes wrong. Take 2 minutes to learn more

Free Crypto Signals Channel
The Lucky Block price prediction moves sideways as the price becomes cheaper for more investors to come into the market.
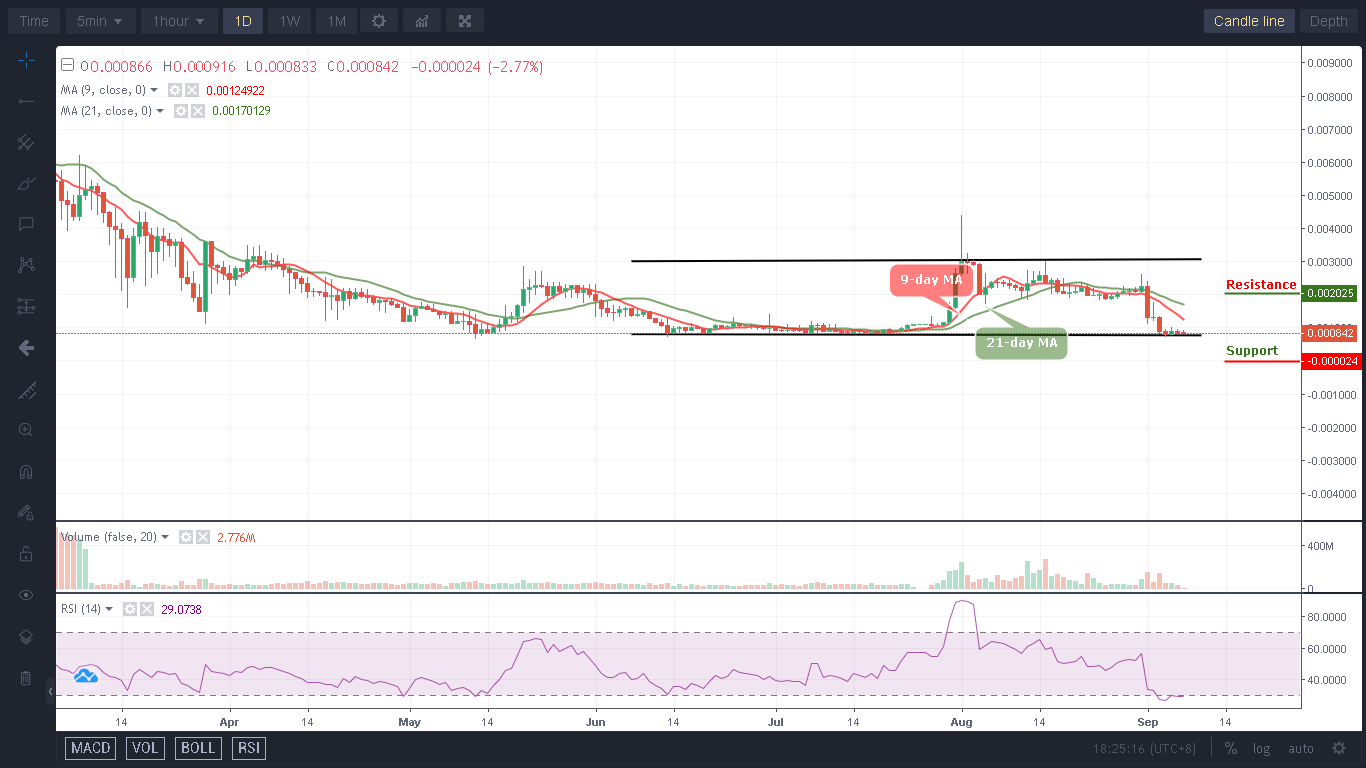
LBLOCK/USD Medium-term Trend: Bearish (1D Chart)
Key Levels:
Resistance levels: $0.0020, $0.0022, $0.0024
Support levels: $0.00024, $0.00022, $0.00020
LBLOCK/USD is preparing for a move higher as the coin pulls back below $0.0010. This movement is necessary for the entry of new investors into the market. Therefore, if the sellers push the market lower, the bears can look for immediate support around the $0.0007 level.
Lucky Block Price Prediction: LBLOCK/USD Gets Ready for a Rebound
The Lucky Block price is below the 9-day and 21-day moving averages; the coin is preparing for a bullish movement as this would be a good opportunity for existing buyers to buy the dip. Meanwhile, the Relative Strength Index (14) technical indicator is moving around the oversold region, any further supports can be found at $0.00024, $0.00022, and $0.00020.
On the contrary, should the buyers hold the current market at $0.0008 and push it above the 9-day and 21-day moving averages, the bulls can look forward to the potential resistance levels at $0.0020, $0.0022, and $0.0024.
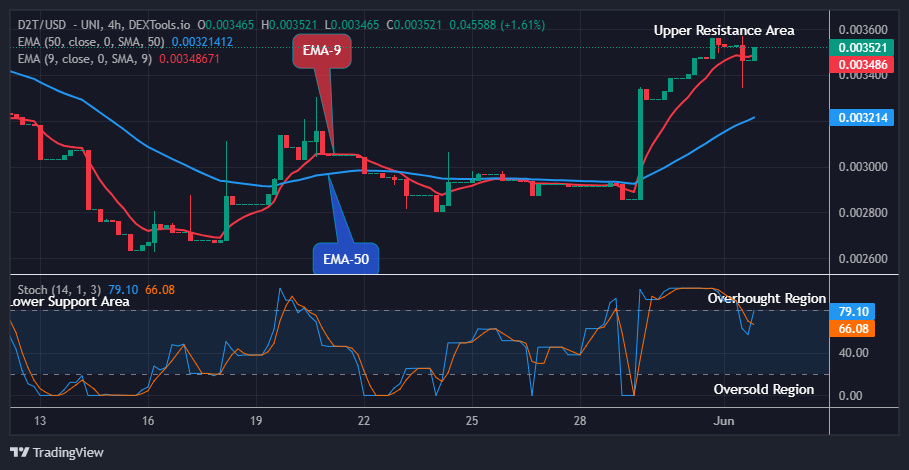
LBLOCK/USD Medium-term Trend: Ranging (4H Chart)
On the 4-hour chart, the Lucky Block (LBLOCK) moves in the same direction as the buyers are coming into the market and this could push the coin to cross above the 9-day and 21-day moving averages.

Looking at the market, the buyers are making an effort to push the coin towards the channel, once this is done, the crypto could hit the resistance level at $0.0016 and above, but any further bearish movement could touch the support at $0.0003 and below as the technical indicator Relative Strength Index (14) remains below 40-level.
You can purchase Lucky Block here. Buy LBLOCK