Don’t invest unless you’re prepared to lose all the money you invest. This is a high-risk investment and you are unlikely to be protected if something goes wrong. Take 2 minutes to learn more
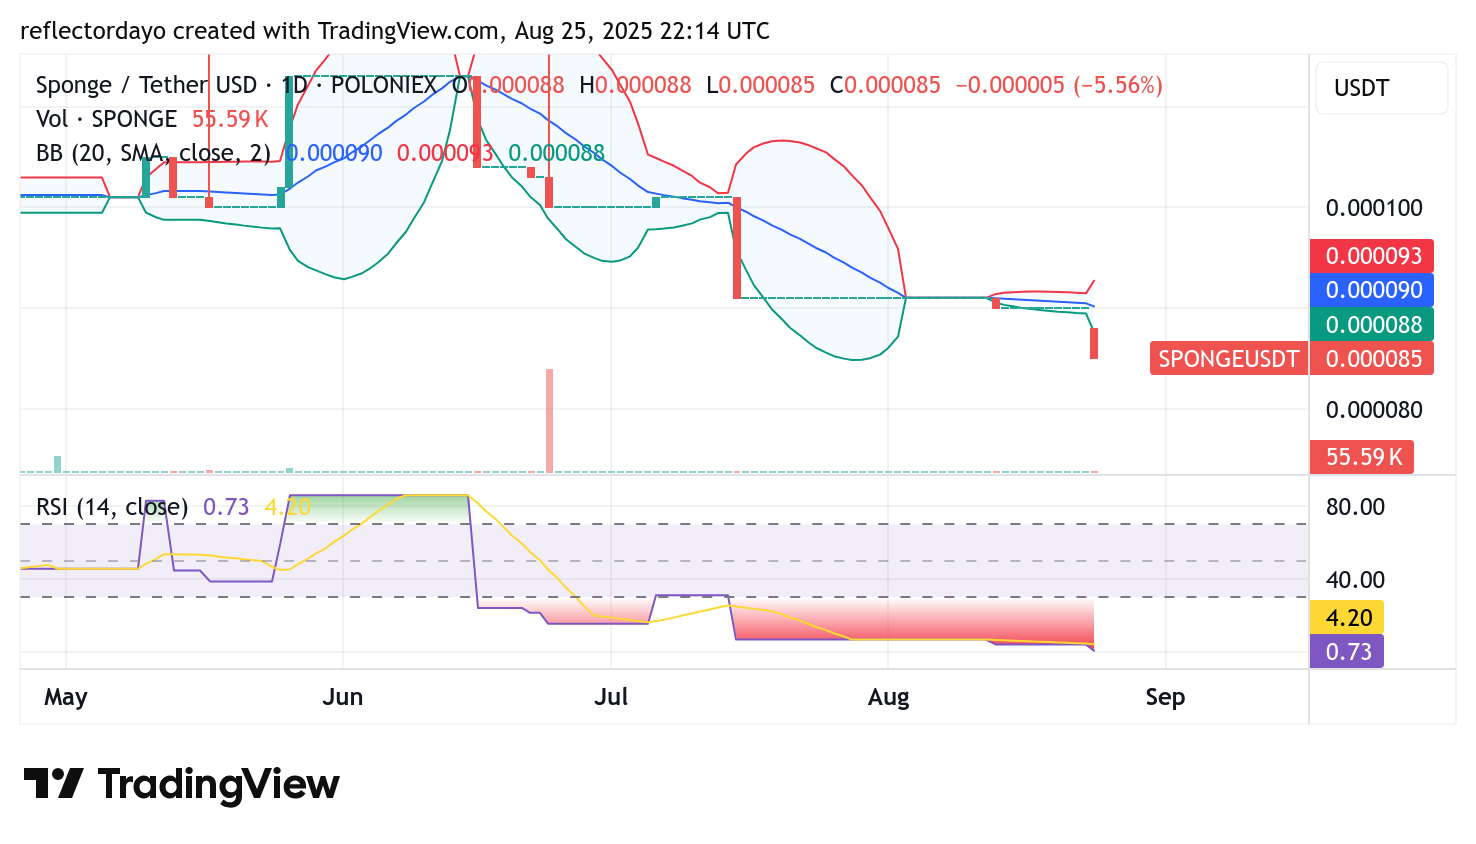
Despite a recent dip below the key $0.00009 support level, SPONGE/USD is showing signs that a potential rebound could be imminent. While bulls were unable to hold their ground, pushing the price down to $0.000085, a closer look at the technical indicators suggests that the market may be gearing up for an upward move.
Key Levels to Watch
Resistance: $0.000115, $0.000120, $0.000130
Support: $0.000085, $0.000080, $0.000075
$SPONGE Daily Chart: Oversold Conditions Point to a Potential Bounce
The daily chart for SPONGE/USD indicates that the market is in a prime position for a reversal. The Relative Strength Index (RSI) has moved deeper into oversold territory, a clear sign of significant selling pressure. Historically, these conditions often lead to a responsive upward correction. The increased volatility also hints that a bounce may be on the way, potentially offering an attractive entry point for traders.
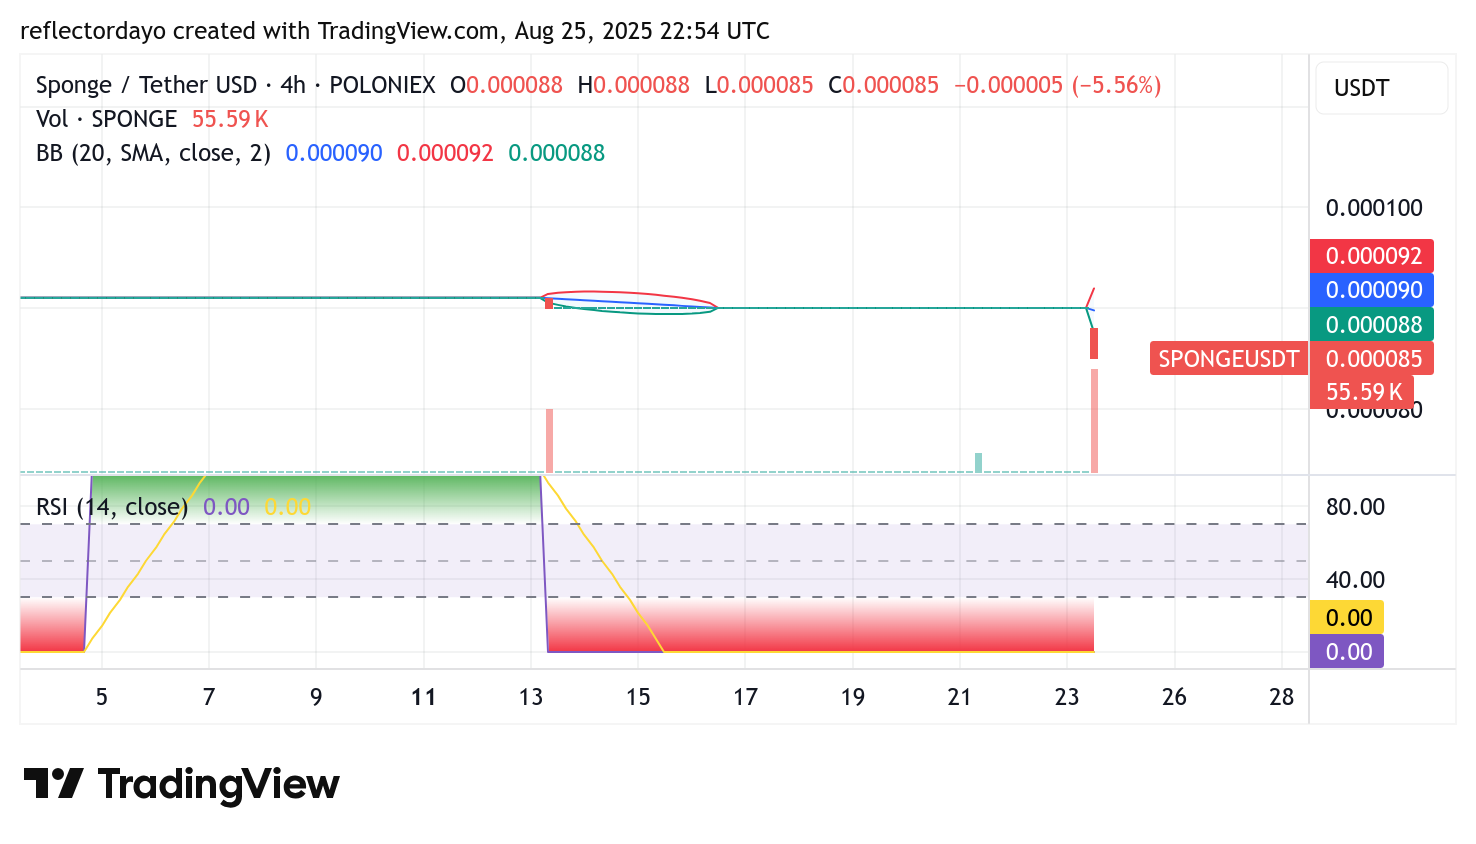
SPONGE/USD 4-Hour Chart: A Surge in Volume Could Signal a Reversal
On the 4-hour chart, recent trading sessions have seen a significant increase in volume, mainly driven by the selloff that followed the break below $0.00009. This spike in activity may have created a temporary supply and demand imbalance. If buyers step in and seize this opportunity, it could trigger a strong rebound, potentially pushing the price back above the $0.00009 level.
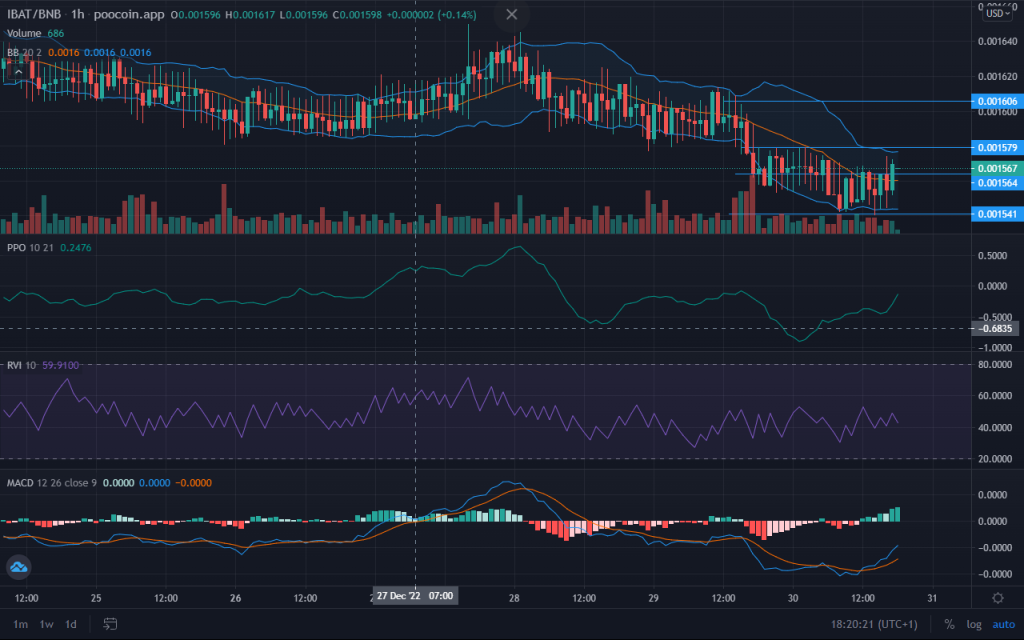
Battle Infinity Forecast – December 30 The Battle Infinity market forecast indicates that buyers are preparing to make steady progress as the bullish trend on the cryptocurrency price grows. IBAT/USD Long-Term: Bullish (1-Hour Chart) Key Levels Supply Zones:$0.0016060, $0.0015790Demand Zones:...
Dogecoin (DOGE) Price Prediction: February 9 The Dogecoin market has significantly dipped over the recent past. Price action in this market is currently just above another technical support. Nevertheless, recent price action suggests that upside forces are attempting to keep the market afloat here ...
In the Tamadoge market, the $0.005 price level held significant historical importance from late February to early March. Consequently, during yesterday’s trading session, as the bear market reached this critical level, anticipation arose for a notable market reversal. However, in the fifth 4-...
We send 3 VIP signals a week in our free Telegram group, each signal comes with a full technical analysis on why we are taking the trade and how to place it through your broker.
Get a taste of what the VIP group is like by joining now for FREE!