BNB (BNB/USDT) Gearing Up for More Upside Gains as Momentum Builds Above $627
Estimated Reading Time: 3 minutes
Don’t invest unless you’re prepared to lose all the money you invest. This is a high-risk investment and you are unlikely to be protected if something goes wrong. Take 2 minutes to learn more
BNB Long-term Analysis: Bullish
The market for BNB against the Tether has shown an early sign of re-accumulation after a prior rally, consolidating above the key moving averages. To this end, this displays a strong underlying support and a long-term traders’ confidence in the pair.
Recently, BNB has shown a rebound from the 200-day SMA, with the bulls gradually regaining control. However, volume is relatively stable, and momentum indicators are bullish, suggesting potential for more gains ahead if resistance zone is cleared.
Currently, BNB trades at $656.84, recording over 65 thousand traded volumes already for the new week.
Technical Indicators
Major Resistance Levels: $680, $730, and $800
Major Support Levels: $627, $606, and $480
BNB Technical Analysis
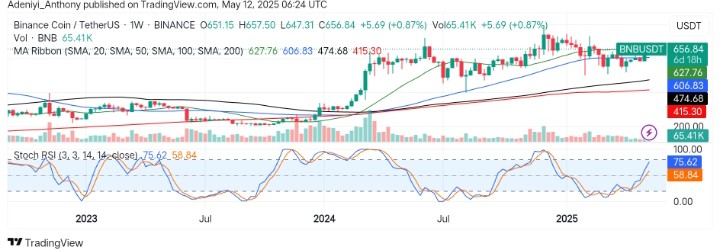
The analysis of the BNB against the Tether on the weekly timeframe shows a market that broke out of a long-term consolidation period as the price now trades above key simple moving averages, signaling a bullish long-term structure.
However, on the other hand, the volume remains steady, with no major distribution, as the Stochastic RSI suggests the pair is aiming towards the overbought region. This suggests momentum is building up for more upside gains.
To this end, a break above the $675 price level in the near term would confirm a trajectory towards $800. Conversely, a move below $606 would negate this setup.
BNB/USDT Analysis: Where from Here?
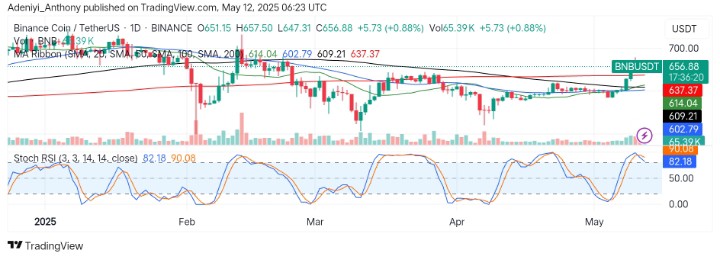
On the daily chart, BNB/USDT appears to be aiming for more gains despite the previous day’s strong momentum, trading above the moving average ribbons as the 20-day moving average takes the same direction. Momentarily, there has been a noticeable influx of daily traded volume, further confirming strong buying interest as more bullish traders enters the market.
From another direction, the Stochastic oscillator suggests an overbought condition for the pair as the blue line curls to the south below the orange line, signaling an impending pullback. However, this move indicates a short-term retracement, strong bullish momentum could fuel a sustained rally.
As it stands, traders can look at the $675 as a potential entry point for a bullish move; meanwhile, a price below $614 could change the course of things.
You can purchase crypto coins here. Buy LBlock