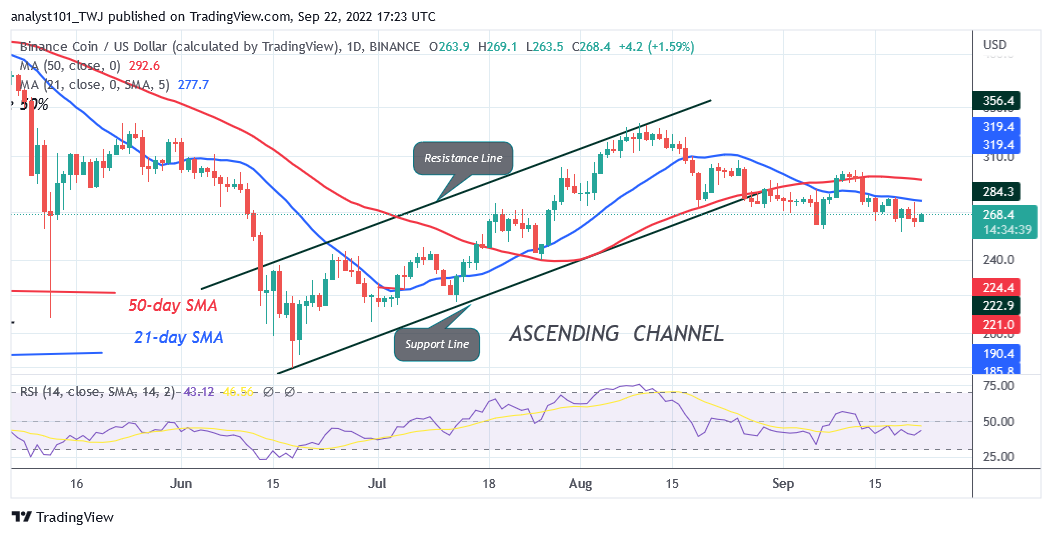
Binance Coin Turns Down from the $300 High as It Targets $245.18 LOW
Estimated Reading Time: 2 minutes
Don’t invest unless you’re prepared to lose all the money you invest. This is a high-risk investment and you are unlikely to be protected if something goes wrong. Take 2 minutes to learn more

Free Crypto Signals Channel
Binance Coin (BNB) Long-Term Analysis: Bearish
Binance Coin’s (BNB) price is in a downtrend as it targets $245.18 low. Since August 19, BNB/USD has been in a range-bound move between $260 and $300 price levels. On the upside, if buyers overcome the resistance at $300,
BNB will rise and revisit the high of $332. Presently, the upward moves are restricted by the 21-day line SMA. The moving average lines are acting as resistance to the price bars. Conversely, if BNB turns down from the moving average lines, the altcoin will decline to the current support at $261.50. The bearish momentum may extend to the $220 or 244 price level.
Binance Coin (BNB) Indicator Analysis
The altcoin is at level 43 of the Relative Strength Index for period 14. BNB is in a downtrend zone and may further decline. The moving average lines are sloping horizontally indicating a sideways move. The price bars are below the moving average lines indicating a further decline. The cryptocurrency is below the 50% range of the daily stochastic. It indicates that the market is in a bearish momentum.
Technical indicators:
Major Resistance Levels – $440, $460, $480
Major Support Levels – $240, $220, $200
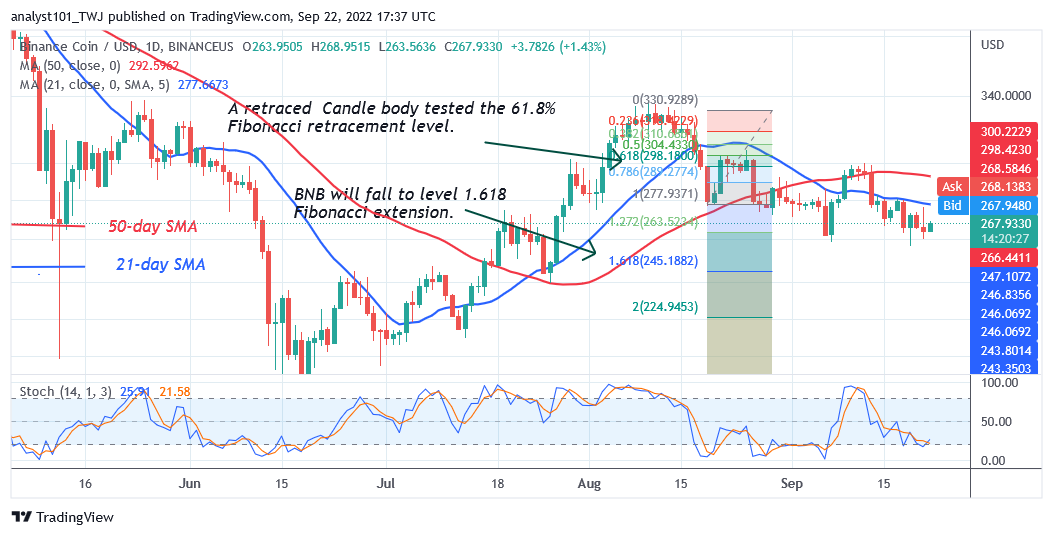
What Is the Next Direction for Binance Coin (BNB)?
Binance Coin turns down from the moving average lines as it targets $245.18 low. Meanwhile, on the August 19 downtrend, a retraced candle body tested the 61.8% Fibonacci retracement level. The retracement suggests that BNB will fall to level 1.618 Fibonacci extensions or $245.18.
You can purchase crypto coins here. Buy LBLOCK
Note: Cryptosignals.org is not a financial advisor. Do your research before investing your funds in any financial asset or presented product or event. We are not responsible for your investing results