Ripple (XRP/USDT) Gearing up for More Upside Improvement Amid Growing Market Caution
Estimated Reading Time: 3 minutes
Don’t invest unless you’re prepared to lose all the money you invest. This is a high-risk investment and you are unlikely to be protected if something goes wrong. Take 2 minutes to learn more
Ripple Long-term Analysis: Bullish
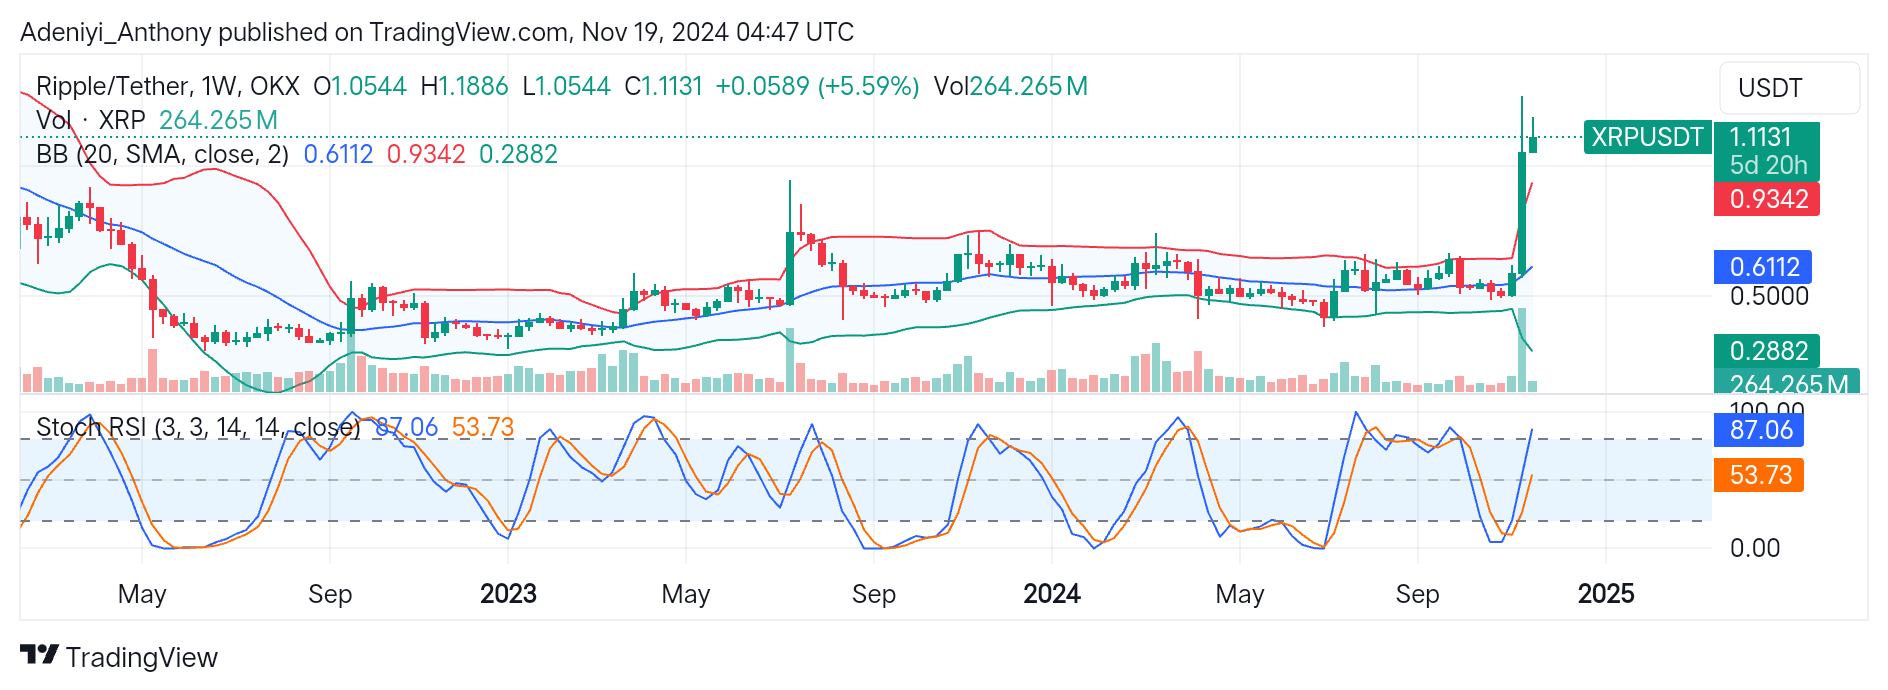
The general market for Ripple (XRP) against the Tether (USDT) appears to be rallying up, as evidenced by the recent sharp upward price movement, accompanied by increased trading volume. However, the current price of the XRP/USDT shows the pair has surged beyond the upper band at $0.9342, signaling a potential overextension of the bullish rally but with strong buying pressure.
The price activities around the $0.6 level indicate that XRP recently broke out from a prolonged consolidation phase, as suggested by the tight Bollinger bands before the spike. However, as the current price action suggests, the bulls aim for more upside actions despite the overbought condition prescribed by the Stochastic RSI.
Currently, XRP/USDT trades at $1.1131 with strong weekly trading volumes of 264.365 million.
Technical Indicators
Major Resistance Levels: $1.1140, $1.2500, and $1.5000
Major Support Levels: $0.6112, $0.5000, and $0.2882
Ripple Technical Analysis
The analysis of Ripple against the Tether on a weekly timeframe shows the pair is currently under bullish pressure with an over-extended price action above the upper band, suggesting a strong bullish breakout.
The current setup above the upper band indicates that the price might move sideways between $1.1100 and $0.9342 if the momentum pauses or retraces in the short term. Bullish traders could use a price pullback to the dynamic mid-band level at $0.6112 as a potential re-entry point to push the price higher towards $1.2500.
On the other hand, the Stochastic RSI shows a mixed signal for the pair; the blue line reading at 87.06 suggests the pair is currently overbought, while the orange line at 53.73 indicates the pair still operates in the neutral zone. However, bullish strength will be renewed at the crossover of the lines.
XRP/USDT Analysis: Expectations
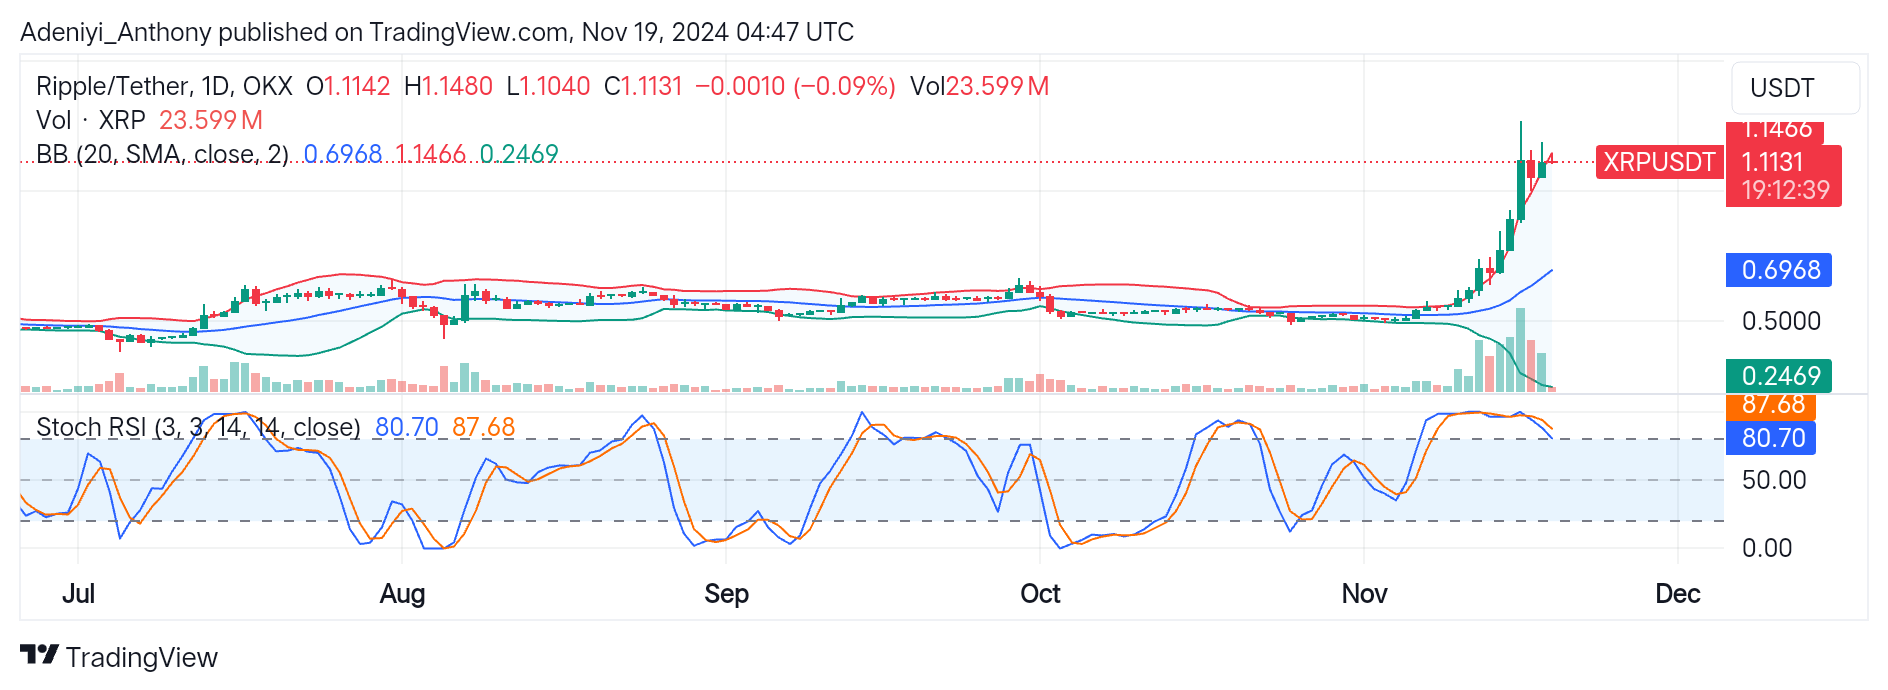
On a daily timeframe, XRP/USDT is experiencing a volume-supported strong uptrend, as seen in the steep rally from the middle line at $0.6968 to the current price at $0.1131. The current price activity above the upper band suggests an overextended condition as well as the recent fall in trading volume. This could indicate the pair may be due for correction.
At the bottom of the chart, the Stochastic RSI suggests an overbought condition, and the current bullish rally may be losing momentum. However, a reversal of lines at 87.68 and 80.70 with sustained bullish pressure could push the price towards the $1.2500 psychological level.
On the contrary, a break below the upper band at $0.9342 with strong selling pressure could drive the price further downward to $0.6968. However, traders should watch for strong volume as the price tests the immediate resistance at $1.1140 for a continued uptrend or a pullback.
You can purchase crypto coins here. Buy LBlock