Wall Street Memes (WSM) Price Resets Footing, Hiking Higher
Estimated Reading Time: 3 minutes
Don’t invest unless you’re prepared to lose all the money you invest. This is a high-risk investment and you are unlikely to be protected if something goes wrong. Take 2 minutes to learn more

Wall Street Memes Price Prediction – October 3
The WSM/USD market resets footing with renewed momentum, hiking higher as buyers reclaim technical strength. Indicators suggest sustainable recovery, positioning the token favorably against the American fiat currency in bullish alignment.
The WSM/USD trade is regaining stable footing, hiking higher with supportive technicals. Long-term position holders are strongly advised to strategically remain within their holding traits, as the broader outlook indicates resilient upward potential. Sustained patience and commitment may unlock significant value as momentum builds against the American fiat currency.
WSM/USD Market
Key Levels
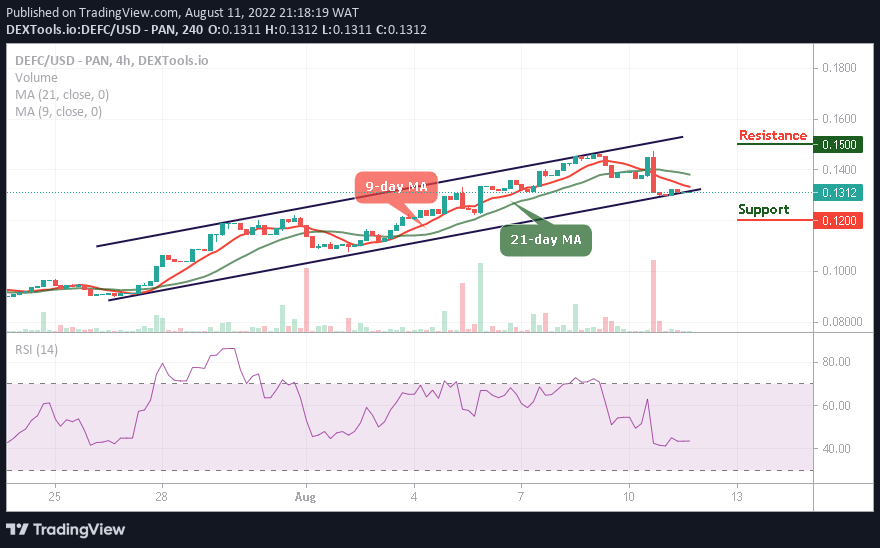
Resistance levels: $0.00065, $0.00075, $0.00085
Support levels: $0.00045, $0.00035, $0.00025
WSM/USD – 4-hour Chart
It is indicated on the WSM/USD medium-term chart that the crypto-economic price is resettling on a foot, as the hiking mood is getting higher.
The Stochastic Oscillators maintain a mild southbound curve, sliding into the oversold region under a bearish signal. Meanwhile, the Bollinger Bands display compressed bearish candlesticks, reflecting buyer readiness to re-engage at discounted lower cost levels.
Is the Crypto-Economic Price Firmly Resettling on Support as Bullish Hiking Momentum Strengthens?
The WSM/USD market’s price appears to be regaining supportive footing, with bullish momentum steadily intensifying.
Technical readings indicate that buyers are tactically reclaiming control, establishing groundwork for higher valuations if momentum persists. Long-term participants are advised to maintain their positions under disciplined holding principles, as sustained commitment offers strategic exposure to broader bullish cycles against the fiat counterpart.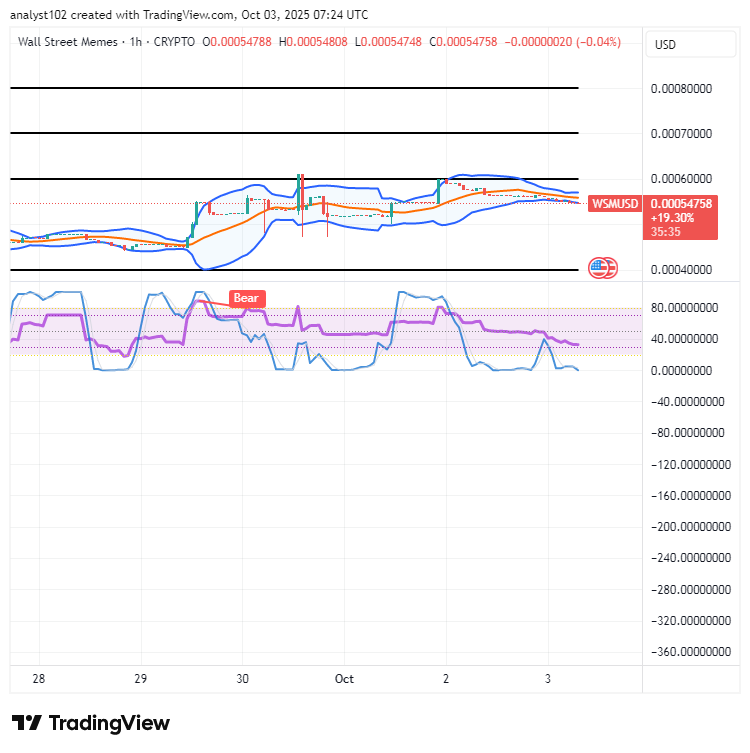
WSM/USD 1-hour chart
The 1-hour chart of WSM/USD shows that the crypto-economic price is resettling its footing, as hiking moves are getting higher.
The Bollinger Bands indicator channels have tilted northward, progressively widening until nearing the crucial threshold of $0.0006. At the same time, the Stochastic Oscillators display a persistent southbound-swerving formation, simultaneously striking a significant trough within the oversold region.
A FEW DAYS LEFT UNTIL A MASSIVE $1M BUYBACK REACHES COMPLETION!
3 DAYS TO GO UNTIL A MASSIVE $1M OF BUYBACKS IS COMPLETED! 🔥 $WSM 🚀
— Wall Street Memes (@wallstmemes) October 8, 2023
Buy Now ➡️ https://t.co/ffr2clEknx pic.twitter.com/bs8uNKIp8D