Wall Street Memes (WSM) Market Adds Muscles, Bulls Steady
Estimated Reading Time: 3 minutes
Don’t invest unless you’re prepared to lose all the money you invest. This is a high-risk investment and you are unlikely to be protected if something goes wrong. Take 2 minutes to learn more

Wall Street Memes Price Prediction – October 2
The Wall Street Memes (WSM/USD) market adds muscles as bullish forces steady against the dollar. Strengthening buy-side activity highlights renewed investor confidence, with growing stability suggesting potential upside resilience despite earlier bearish exhaustion.
The WSM/USD market structure indicates a stronger bullish footing as buyers consolidate positions against the dollar. The steady momentum reflects improving liquidity and trading conviction, with investor sentiment shifting favorably. Such dynamics highlight the potential for sustained upward traction, as underlying market resilience continues to counter prior bearish pressures with notable stability.
WSM/USD Market
Key Levels
Resistance levels: $0.00065, $0.00075, $0.00085
Support levels: $0.00045, $0.00035, $0.00025
WSM/USD – 4-hour Chart
The WSM/USD medium-term chart reveals the crypto base market adds muscles to touch resistances around $0.0006, making bulls stay steady.
The Bollinger Bands indicators have resorted to stretching northward slightly on a systemic bullish mood. The Stochastic Oscillators are in the mode of conjoining closely toward the line of 80, strongly showing that aggressive buying forces are steadily on the increase.
Will the WSM/USD Market Continue Adding Muscles as Bulls Hold Their Steady Ground?
The WSM/USD market shows continued resilience, as bullish strength holds firm and accumulative buying reinforces momentum. This steady posture highlights improving investor confidence and raises the likelihood of sustained upside activity in forthcoming sessions.
Despite WSM/USD showing firm bullish strength, traders should exercise caution against premature selling thoughts near $0.0006. Current market resilience and steady buying momentum suggest that liquidating positions too early could forfeit potential gains, as structural dynamics remain supportive of further upside traction, with only limited bearish triggers currently evident in the setup.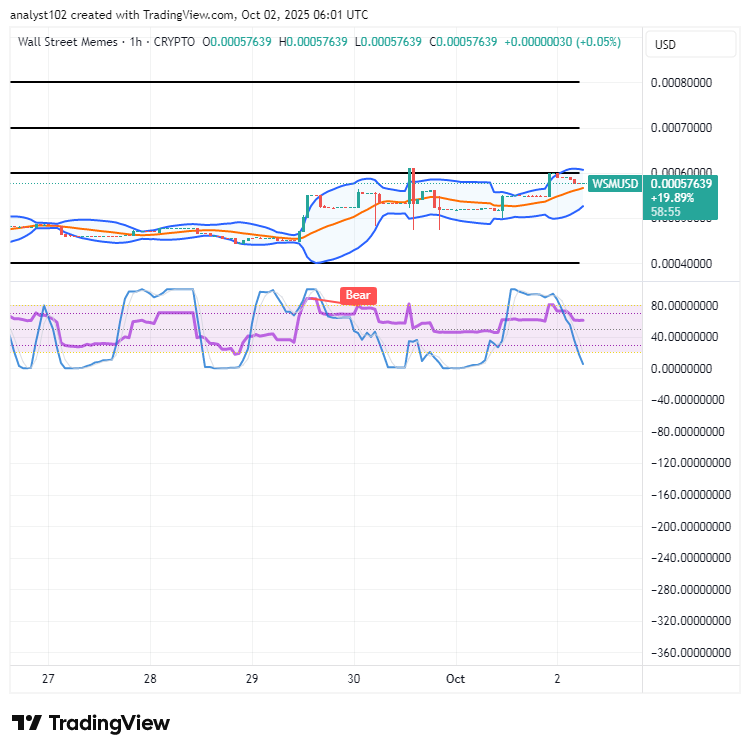
WSM/USD 1-hour chart
The 1-hour chart of WSM/USD showcases that the crypto market adds muscles, and bulls are steady.
The Bollinger Bands trend lines have placed northward, gradually expanding to the extent of reaching the key point of $0.0006. Meanwhile, the Stochastic Oscillators are in a southbound-swerving outlook, simultaneously touching a decisive dip in the oversold region.
$WSM community, we saw your Tweets! 👏 We truly appreciate your strong support. $WSM/$USDT is now officially tradeable on #Bybit Perpetuals, marking another exciting milestone for the project.
$WSM community, we saw your Tweets! 👏$WSM / $USDT is now tradeable on #Bybit Perpetuals.
— Bybit (@Bybit_Official) October 13, 2023
Trade here: https://t.co/le4XyVyXaZ
Also want your project listed? Share your suggestions here:https://t.co/W7EWJVVNV5 https://t.co/XgXoL7g0rF