Wall Street Memes (WSM) Trades Reshape, Recuperating Hikes
Estimated Reading Time: 3 minutes
Don’t invest unless you’re prepared to lose all the money you invest. This is a high-risk investment and you are unlikely to be protected if something goes wrong. Take 2 minutes to learn more

Wall Street Memes Price Prediction – October 1
The Wall Street Memes (WSM) market shows signs of recovery against the US currency, as recent trading reshapes momentum with recuperating hikes, suggesting buyers gradually regain footing despite previous pressure from dollar strength and market fluctuations.
The Wall Street Memes (WSM) market has been showcasing renewed traction against the US currency, with recuperating hikes highlighting upside momentum. However, traders should remain cautious, as potential downside fluctuations cannot be ruled out. While short-term indicators support sustained bullish traction, vigilance is necessary to manage risks, balancing optimism with awareness of possible corrective pullbacks.
WSM/USD Market
Key Levels
Resistance levels: $0.0006, $0.0007, $0.0008
Support levels: $0.0004, $0.0003, $0.0002
WSM/USD – 4-hour Chart
The WSM/USD medium-term chart reveals the crypto trades are reshaping, as long-term position holders are recuperating in their mood to hike.
The Stochastic Oscillators are in the mode of conjoining together to formulate a kind of downward bullish flag shape toward the critical point of 40. The Bollinger Bands indicators are now embodying variant candlesticks principally around the upper and the middle pivotal parts.
Will Reshaping Trades Sustain Momentum as Long-Term Holders Recuperate in Their Hiking Mood?
Reshaping trades appear to sustain momentum as the WSM/USD market long-term holders recuperate with renewed confidence. Market signals suggest further upside potential, though caution remains necessary against sudden retracements that could disrupt bullish continuity.
The sustained momentum from reshaping trades reinforces the confidence of long-term holders, complementing the broader bullish structure. Nevertheless, prudent caution is advised, as unexpected fluctuations or corrective retracements could temporarily interrupt progress, requiring traders to balance optimism with readiness for swift market adjustments.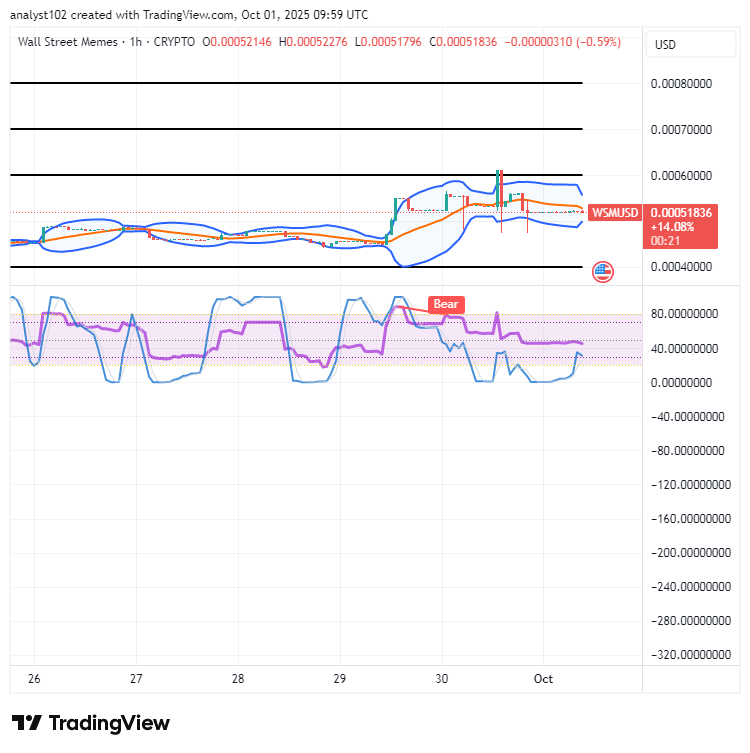
WSM/USD 1-hour chart
The 1-hour chart of WSM/USD shows that the base instrument trades are reshaping at the basis, making the price recuperation progress.
The Stochastic Oscillators have dipped into the oversold region with only a mild bearish signal, clearly suggesting sellers may have reached a considerable final exhaustion phase. The Bollinger Bands trend lines are positioned northward, firmly establishing the resistance level at $0.0006 as the primary critical zone for potential upward moves.
Explore fresh trading possibilities with flexible 1-25x leverage. Even better, they’re now available on Bybit Futures Grid Bot! Begin your trades today.
BIGTIME: [https://i.bybit.com/20rabgrK](https://i.bybit.com/20rabgrK)
WSM: [https://i.bybit.com/ab1F9gWH](https://i.bybit.com/ab1F9gWH)
🚀 BIGTIMEUSDT & WSMUSDT Contracts now on Bybit!
— Bybit (@Bybit_Official) October 12, 2023
Dive into new trading opportunities with 1-25x leverage. Plus, they’re now on Bybit Futures Grid Bot! Start trading now.
📈 BIGTIME: https://t.co/FAQlbhnzAh
📈 WSM: https://t.co/pb2y2AfMBE#CryptoTrading #Bybit
Buy and stake WSM now! https://wallstmemes.com/