Wall Street Memes (WSM) Prices Get Fueling, Buyers Are Steady
Estimated Reading Time: 3 minutes
Don’t invest unless you’re prepared to lose all the money you invest. This is a high-risk investment and you are unlikely to be protected if something goes wrong. Take 2 minutes to learn more

Wall Street Memes Price Prediction – September 30
The Wall Street Memes (WSM) market continues pairing with the US dollar, fueling steady price momentum as persistent buyers sustain upside confidence, reinforcing bullish traction within broader short-term trading activities.
Bullish sentiment dominates as Wall Street Memes (WSM) maintains resilience against the US dollar, with firm buyer accumulation supporting higher ground. Technical indicators reflect strengthening upside momentum, while consistent demand flow suggests bulls are steadily consolidating control, potentially driving further extensions toward reinforced resistance levels in the near term.
WSM/USD Market
Key Levels
Resistance levels: $0.0006, $0.0007, $0.0008
Support levels: $0.0004, $0.0003, $0.0002
WSM/USD – 4-hour Chart
The WSM/USD medium-term chart reveals the crypto-economic prices are getting fuel, as buyers are staying steady.
The Bollinger Bands indicators have been gradually and systematically expanding toward the upper region, with varied candlesticks signaling that a long-term trading bias is firmly developing. The Stochastic Oscillators have also moved decisively northward, strongly reaffirming sustained upward momentum.
How Sustainable Are WSM/USD Price Gains as Buyers Remain Steady and Provide Fueling Momentum?
WSM/USD price gains appear sustainable as steady buyers consistently fuel momentum. With firm accumulation patterns supporting bullish sentiment, technical indicators suggest continued upward potential, though caution remains advisable against sudden resistance-driven pullbacks in the near term.
WSM/USD price gains appear sustainable as steady buyers consistently fuel momentum. With accumulation patterns supporting bullish sentiment, indicators favor further upside. However, patient holding is encouraged, as long-term prospects remain constructive despite possible short-term resistance-driven pauses.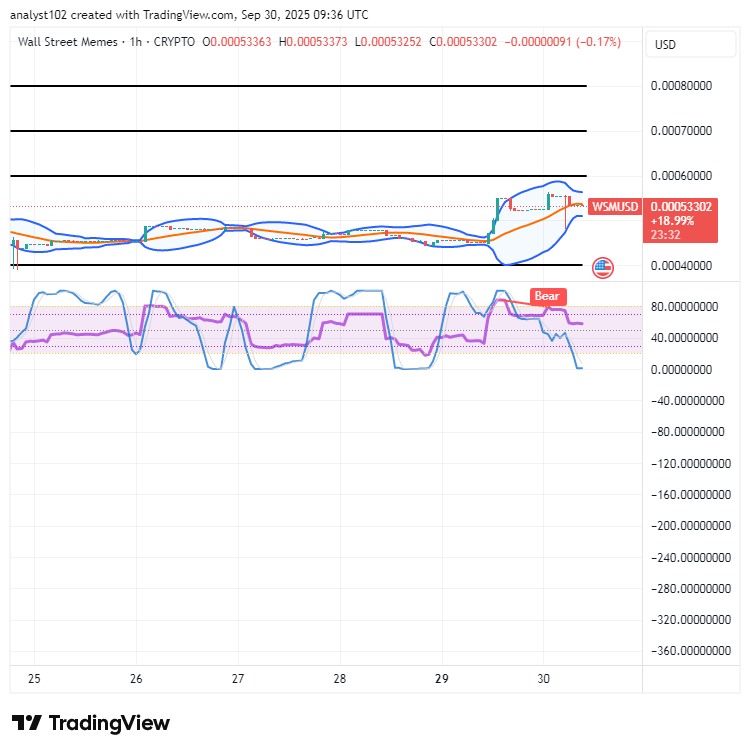
WSM/USD 1-hour chart
The 1-hour chart of WSM/USD shows renewed momentum, as underlying buyers remain steady in their moves, consistently fueling price stability and reinforcing short-term bullish traction.
The Bollinger Bands trend lines are positioned northward, establishing the resistance level at $0.0006 as the primary zone for potential upward moves. The Stochastic Oscillators have dipped into the oversold region with only a mild bearish signal, suggesting sellers may have reached a considerable final phase.
Explore fresh trading opportunities with flexible 1–25x leverage. WSM and BIGTIME are now live on Bybit Futures Grid Bot, giving traders enhanced tools to capture volatility and maximize potential gains. Start trading today!
Up To 43% APY Staking Rewards Now Live 🔥
(accurate at the time of posting)
Stake Today ➡️ [https://wallstmemes.com/en/dashboard](https://wallstmemes.com/en/dashboard) Buy Instantly ➡️ [https://wallstmemes.com](https://wallstmemes.com)
🔥 Up To 43% APY Now Available 🔥
— Wall Street Memes (@wallstmemes) October 8, 2023
(at the time of posting)
Stake Now ➡️ https://t.co/X031FQo0bW Buy Now ➡️ https://t.co/6zkwWf1VRF pic.twitter.com/o9qrY1zJn8