Wall Street Memes (WSM) Market Is Shaping, Bears Lose Holds
Estimated Reading Time: 3 minutes
Don’t invest unless you’re prepared to lose all the money you invest. This is a high-risk investment and you are unlikely to be protected if something goes wrong. Take 2 minutes to learn more

Wall Street Memes Price Prediction – September 28
The trading posture between Wall Street Memes (WSM) and the US dollar indicates a market reshaping, as bearish momentum gradually weakens amid improving structural stability.
Recent WSM/USD market candlestick formations highlight contracting downside pressure, while Bollinger Bands reveal narrowing volatility as price action hovers near the lower band, signaling weakening bearish strength. A potential rebound toward the midline or upper band, reinforced by oversold Stochastic Oscillators, suggests an imminent bullish turnaround.
WSM/USD Market
Key Levels
Resistance levels: $0.0006, $0.0007, $0.0008
Support levels: $0.0004, $0.0003, $0.0002
WSM/USD – 4-hour Chart
The WSM/USD medium-term chart indicates the crypto-economic market is reshaping around a lower trading zone, as bearish momentum gradually weakens.
The Stochastic Oscillators have traversed northbound systemically in a decisive manner, revalidating upward movements convincingly. The Bollinger Bands show that a clearer set of lighter candlesticks has gradually emerged between the upper and the middle parts.
Will the WSM/USD Market Sustain a Rebound as Bearish Momentum Gradually Weakens?
The WSM/USD market displays early signs of stabilization, as weakening bearish momentum combines with narrowing Bollinger Bands and supportive Stochastic readings, suggesting a possible short-term rebound toward higher resistance levels.
The WSM/USD trade is stabilizing as bearish forces weaken, while improving momentum and strengthening demand dynamics further reinforce immediate prospects of a sustainable and extended bullish rebound ahead.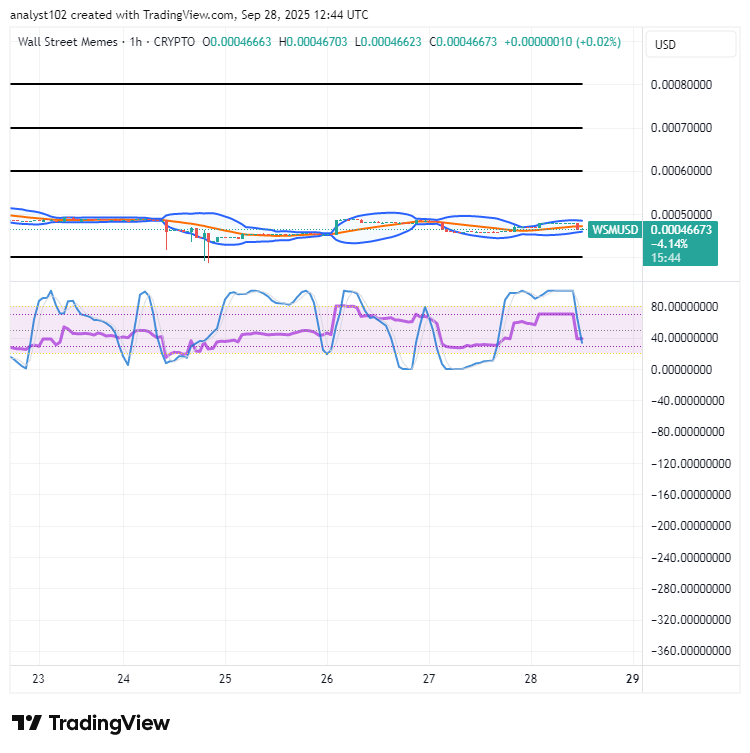
WSM/USD 1-hour chart
The 1-hour chart of the WSM/USD market is forming a baseline structure, as bearish momentum eases and sellers gradually lose strength in their trading posture.
The Stochastic Oscillators have been steadily swerving around, strongly signaling the best possible time to confidently secure more points staked while being strategically positioned at lower trading values. The Bollinger Bands trend lines have now compressed closely together, with decisive narrowing forming around the critical $0.0005 level, suggesting reduced bearish dominance and strengthening prospects of an imminent bullish breakout.
Explore fresh trading opportunities with flexible 1–25x leverage. WSM and BIGTIME are now live on Bybit Futures Grid Bot, giving traders enhanced tools to capture volatility and maximize potential gains. Start trading today!
$WSM community, we proudly saw your amazing Tweets!
$WSM/$USDT is now officially tradeable on #Bybit Perpetuals.
Start trading right here today: [https://i.bybit.com/1Wab4K3z](https://i.bybit.com/1Wab4K3z)
$WSM community, we saw your Tweets! 👏$WSM / $USDT is now tradeable on #Bybit Perpetuals.
— Bybit (@Bybit_Official) October 13, 2023
Trade here: https://t.co/le4XyVyXaZ
Also want your project listed? Share your suggestions here:https://t.co/W7EWJVVNV5 https://t.co/XgXoL7g0rF
Buy and stake WSM now! https://wallstmemes.com/