Wall Street Memes (WSM) Trade Slides, Buyers Retain Interest
Estimated Reading Time: 3 minutes
Don’t invest unless you’re prepared to lose all the money you invest. This is a high-risk investment and you are unlikely to be protected if something goes wrong. Take 2 minutes to learn more
Wall Street Memes Price Prediction – September 27
Wall Street Memes coin trade briefly slides against the US dollar, yet buyers retain interest as valuation dynamics show resilience, with underlying momentum suggesting potential stabilization and renewed upward traction within evolving market structures.
Despite recent slides, Wall Street Memes coin continues to attract buying interest against the US dollar, reflecting confidence in its market potential. Strengthening short-term support zones and stabilizing technical indicators reinforce prospects for recovery, suggesting buyers may gradually consolidate control and validate upward continuation.
WSM/USD Market
Key Levels
Resistance levels: $0.0006, $0.0007, $0.0008
Support levels: $0.0004, $0.0003, $0.0002
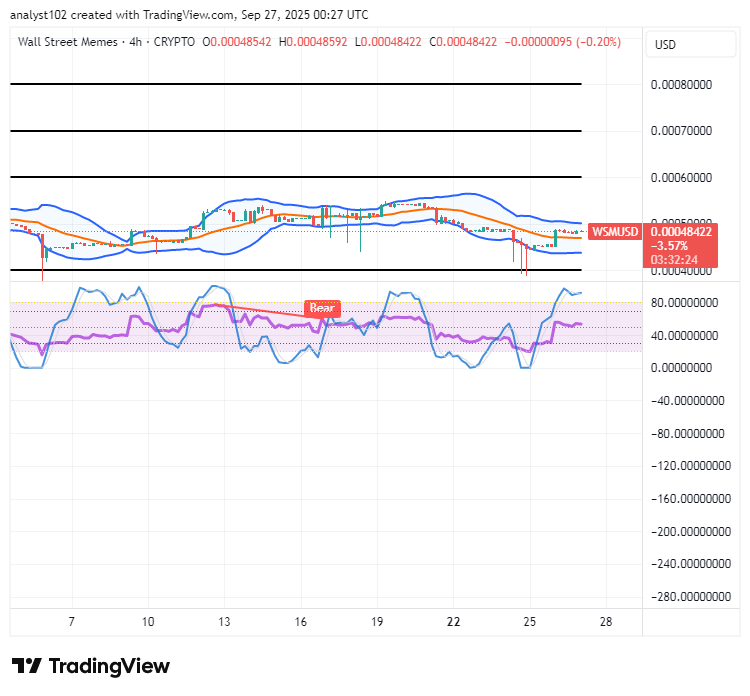
WSM/USD – 4-hour Chart
The WSM/USD medium-term chart indicates the crypto-economic trade slides, as buyers retain upward interest.
A look at the Bollinger Bands shows that a set of lighter candlesticks has gradually emerged between the upper and the middle part. The Stochastic Oscillators have also penetrated the overbought region, clearly signaling that bulls are yet in the mode of making harder, sustained effort.
Will Buyers Sustain Upward Interest as the Trade Slides Amid Emerging Technical Market Signals?
WSM/USD market buyers sustaining upward interest amid sliding trade reflects an undercurrent of conviction, where technical distortions may mask latent strength. Such divergence often precedes structural recalibration, hinting at potential bullish emergence once sentiment and positioning converge more decisively.
Rather than dwelling on movements beneath fleeting downside extremes, it is wiser to recognize underlying resilience. Temporary slides often exaggerate weakness, while consolidating buyers steadily reinforce structural balance, preparing the ground for sustainable recovery and eventual upward validation.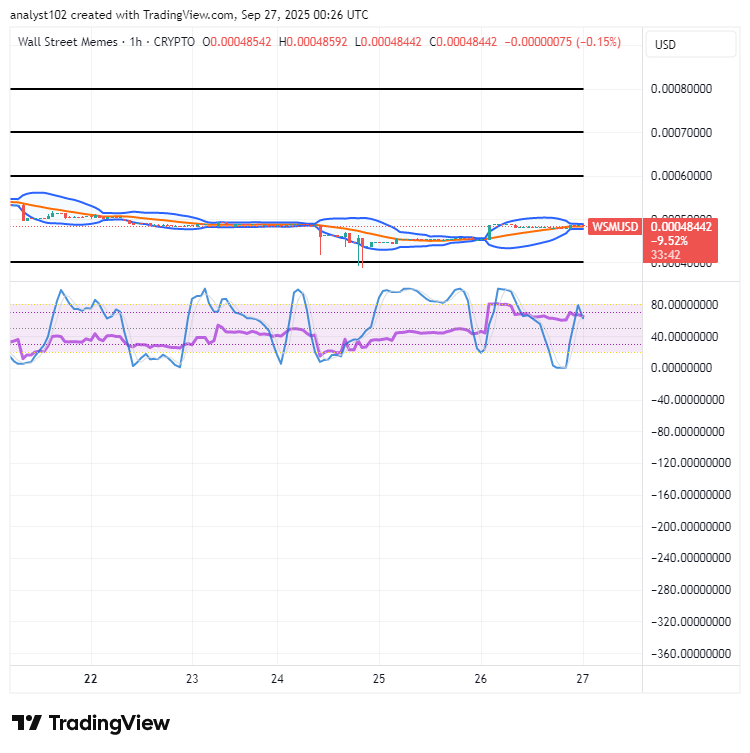
WSM/USD 1-hour chart
The 1-hour chart of the WSM/USD market slightly slides, as buyers retain upward interest in the crypto’s economy.
The Stochastic Oscillators have been steadily swerving about to indicate the best possible time to get more points confidently staked while positioned at lower values. The Bollinger Bands trend lines have now compressed closely to the critical level of $0.0005.
Explore fresh trading opportunities with flexible 1–25x leverage. WSM and BIGTIME are now live on Bybit Futures Grid Bot, giving traders enhanced tools to capture volatility and maximize potential gains. Start trading today!
Earn Up To 43% APY Now Available
(at the current time of posting) — Stake Instantly ➡ [https://wallstmemes.com/en/dashboard]
Buy Conveniently ➡️ [https://wallstmemes.com](https://wallstmemes.com)
🔥 Up To 43% APY Now Available 🔥
— Wall Street Memes (@wallstmemes) October 8, 2023
(at the time of posting)
Stake Now ➡️ https://t.co/X031FQo0bW Buy Now ➡️ https://t.co/6zkwWf1VRF pic.twitter.com/o9qrY1zJn8