Bitcoin (BTC/USD) Market Reverses to $22,500
Estimated Reading Time: 3 minutes
Don’t invest unless you’re prepared to lose all the money you invest. This is a high-risk investment and you are unlikely to be protected if something goes wrong. Take 2 minutes to learn more

Free Crypto Signals Channel
Bitcoin Price Prediction – July 24
There has been a notable rise in the valuation of BTC/USD trade operations toward the $25,000 resistance line in the last couple of days as the market reverses to $22,500. Price is trading around $22,425 at a minute negative percent of 0.22 as of writing.
BTC/USD Market
Key Levels
Resistance levels: $25,000, $27,500, $30,000
Support levels: $20,000, $17,500, $15,500
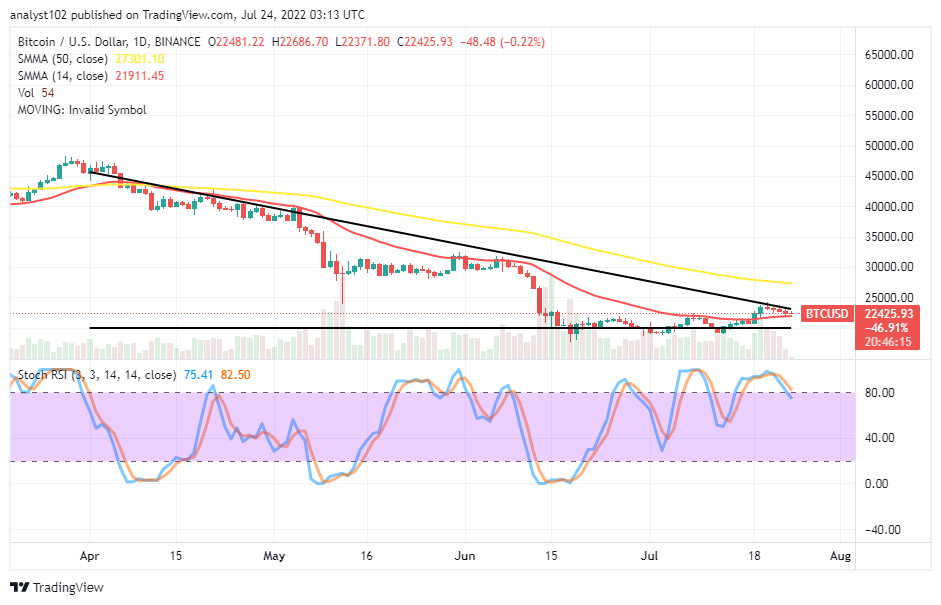
BTC/USD – Daily Chart
The BTC/USD daily chart reveals the crypto-economic market reverses from a higher-trading point, near below the $25,000 resistance level, to a lower-trading zone around the $22,500 value line. The 14-day SMA indicator is underneath the 50-day SMA indicator. And they are located in the $21,911 and $27,301 value ranges. The horizontal line drew at the $20,000 support level to remain to mark the point as the critical baseline toward a presumed possibility of aggressively declining motion. The Stochastic Oscillators have slightly crossed southbound from the overbought region to touch a point of around the 80 range.
Are there indications backing the probability of downs in the BTC/USD market now?
There seem to be variant indications suggesting the possibility of downs in the BTC/USD trade as the crypto-economic market reverses to $22,500 after the price lacks the catalyst to surge higher further through some other overhead resistance trading levels in the recent operations. Based on that, it would be technically acceptable to suspend new buying orders around the trend line of the 14-day SMA for a while. However, in the meantime, long-position takers may have to be alert to when there’ll be a bullish candlestick at a lower-trading station before considering a buying order afterward.
On the downside of the technical analysis, the pace for selling appears to be settling gradually below the $25,000 resistance level. The BTC/USD market short-position takers ought to have launched a sell order between 20 and 21 days’ sessions to maximize the advantage of the current retracement to the downside. The shorting of positions around the trend line of the 14-day SMA now might be a bit late. But, to some extent could be more technically inclining than buying.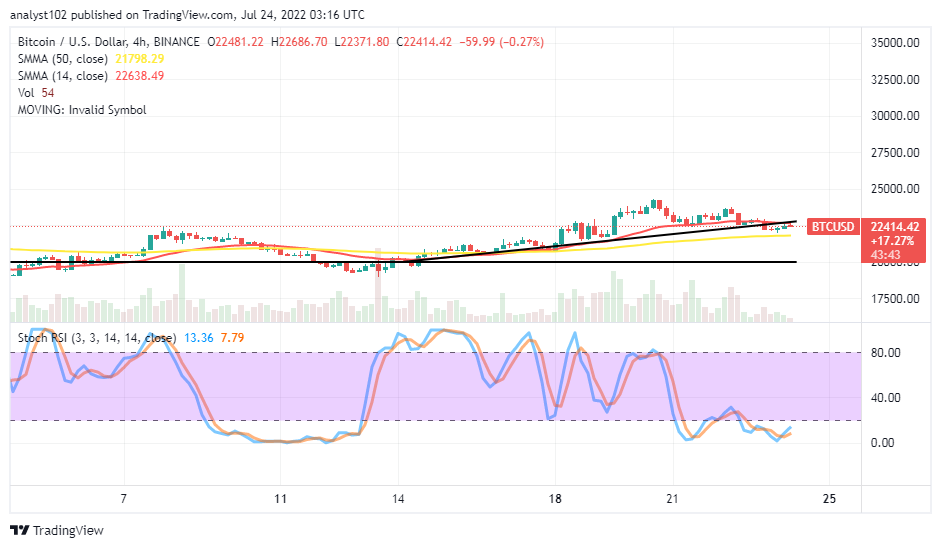
BTC/USD 4-hour Chart
The BTC/USD medium-term chart showcases the crypto market reverses to $22,500 in an attempt to move further to the downside. The 14-day SMA indicator has crossed the 50-day SMA indicator to the upside. And they indicate some points at $22,638 and $21,798. The Stochastic Oscillators are in the oversold region. And they are somewhat moving in a consolidation manner. At this point, it may be dicey to denote the next direction that price may opt to go. Therefore, traders may need to relax in decision-making toward this crypto economy.
Note: Cryptosignals.org is not a financial advisor. Do your research before investing your funds in any financial asset or presented product or event. We are not responsible for your investing results.
You can purchase Lucky Block here. Buy LBLOCK:


