Synthetix (SNXUSD) Experiences a Pullback After Displacement in the Market.
Estimated Reading Time: 2 minutes
Don’t invest unless you’re prepared to lose all the money you invest. This is a high-risk investment and you are unlikely to be protected if something goes wrong. Take 2 minutes to learn more

Free Crypto Signals Channel
SNXUSD Analysis: The Market Experiences Pull Back After Displacement
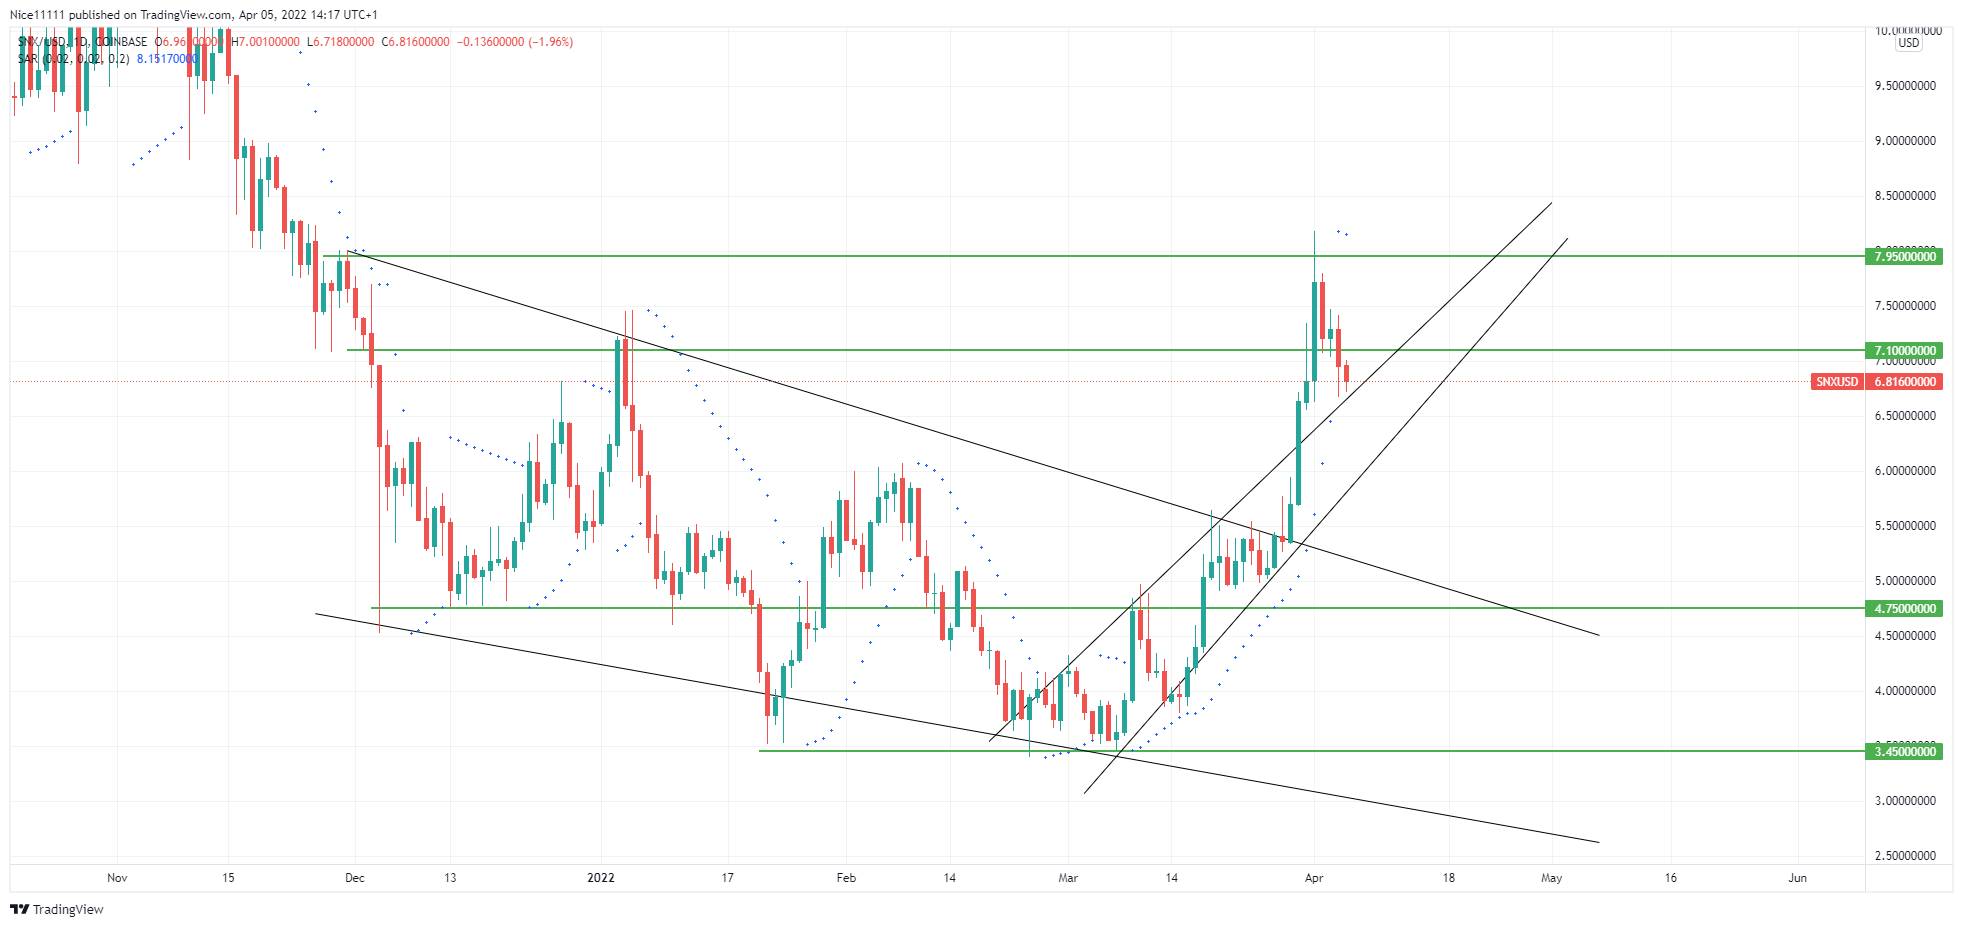
SNXUSD experiences a pullback after displacement. There was a bearish swing in the market, which started on the 30th of November. Before the volatile swing, there was a choppy bearish move. The market immediately dropped to $4.750.The support zone led to a momentary pullback after the displacement in the market. The market gyrated to the resistance zone at $7.500.
Major Zones of the SNXUSD
Support Zones: $4.750 $3.450
Resistance Zones: $7.950, $7.100
The resistance zone caused an influx of sellers to storm the market once again. This led to a displacement in the market. The previous demand zone at $4.750 was violated. The market dipped to $3.450. The market tested the demand zone and bounced back to the region within the supply zone at $7.100 and the demand zone at $4.750. After clearing previous highs on the daily chart, the market returned to the demand zone at $3.450.
The market consolidated from February into March. On the 9th of March, there was a bullish displacement in the market. The displacement reached the previous demand zone at $4.750. SNXUSD experienced a pullback after the displacement in the market. The pullback helped the bulls gather the momentum to spring up to the resistance zones at $7.100 and $7.950.

Market Predictions
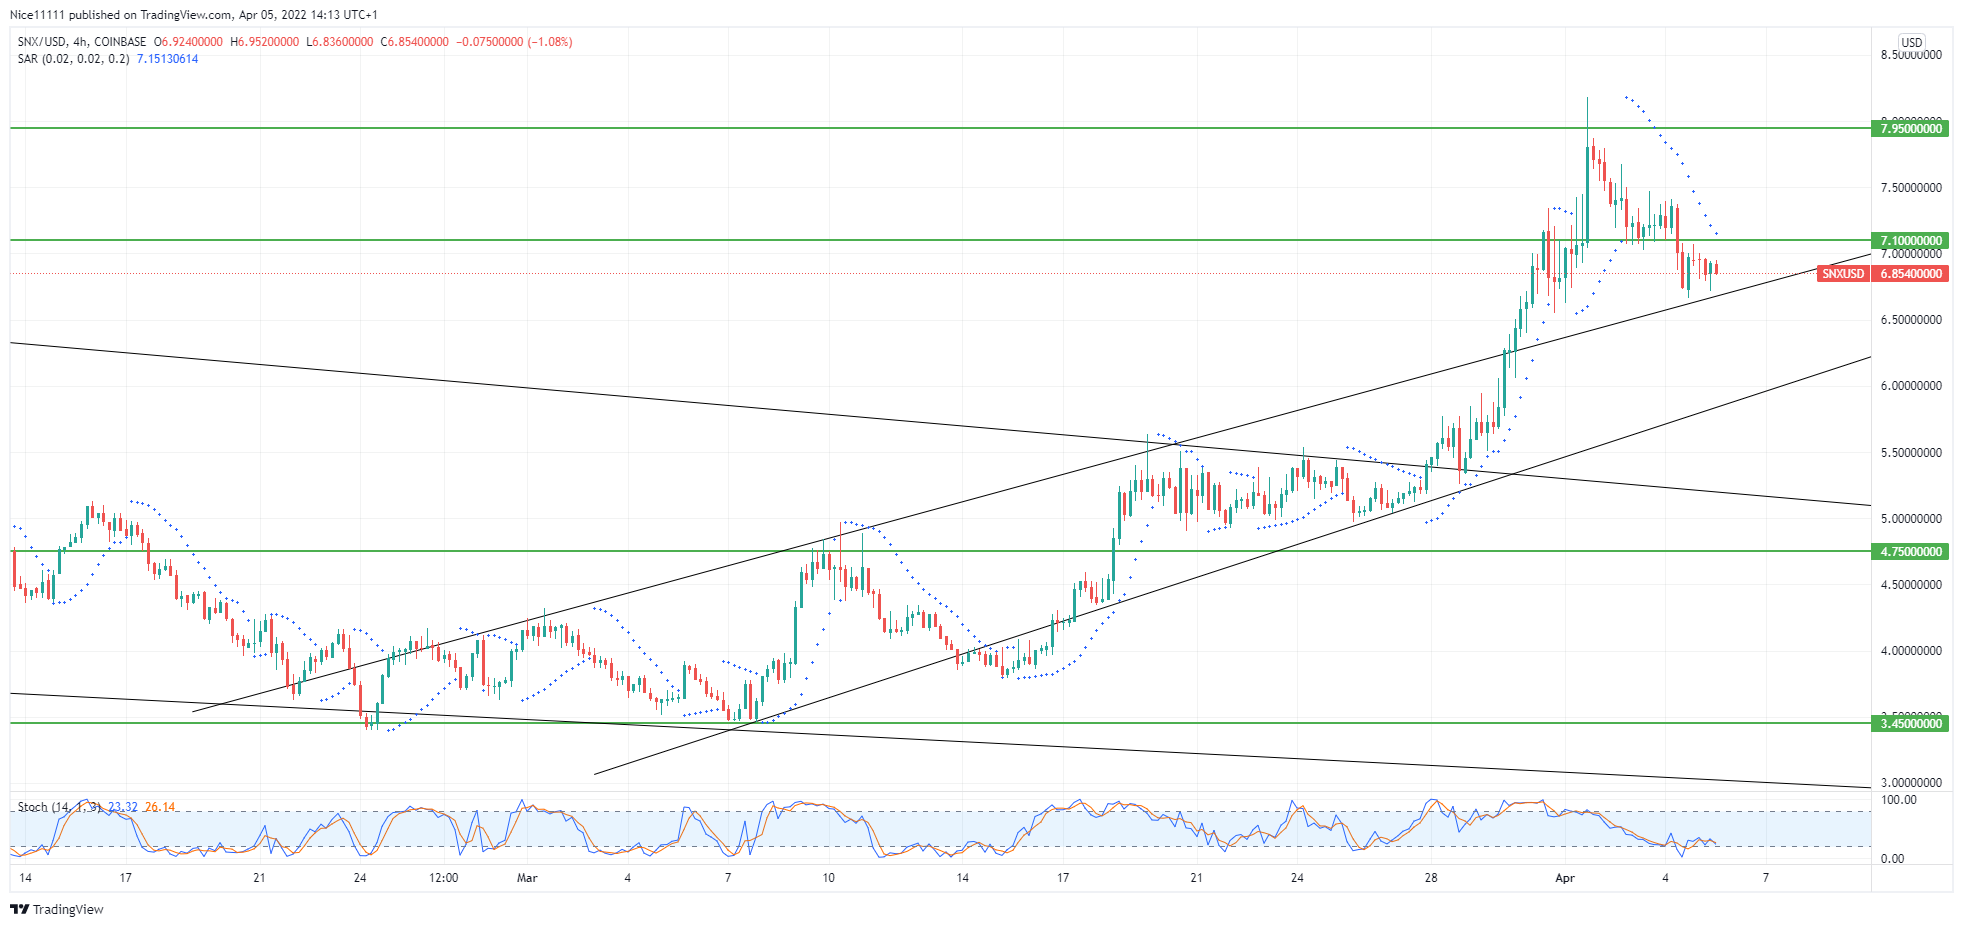
The successful displacement in the market faced resistance at $7.950. A shadow formed above the bullish candle on the 1st of April. SNXUSD is currently experiencing a pullback after displacement in the market. The price has fallen below the lower resistance zone at $7.100. The Parabolic SAR shows that the market is on a bearish run. The bearish move is expected to be momentary as the Stochastic is not indicating a buy currently on the four-hour chart. The market is likely to rest on the upper border of the ascending channel towards $4.750 to regain bullish moments.
How To Buy Lucky Block
Note: Cryptosignals.org is not a financial advisor. Do your research before investing your funds in any financial asset or presented product or event. We are not responsible for your investing results.