Lucky Block Price Prediction: LBLOCK/USD Bounces Above $0.0020
Estimated Reading Time: 3 minutes
Don’t invest unless you’re prepared to lose all the money you invest. This is a high-risk investment and you are unlikely to be protected if something goes wrong. Take 2 minutes to learn more

Free Crypto Signals Channel
The Lucky Block price prediction shows that the coin crosses above the 9-day moving average for the coin to shoot to the upside.
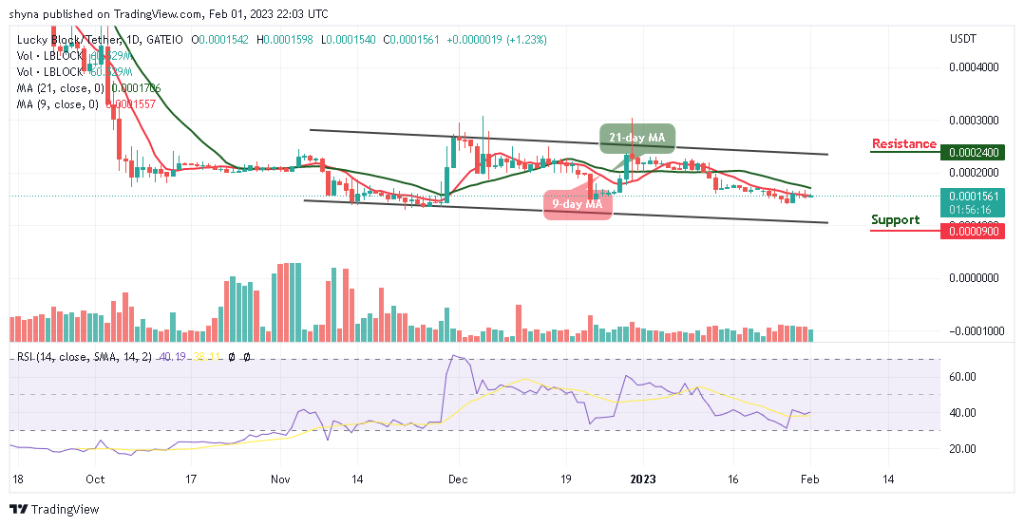
LBLOCK/USD Medium-term Trend: Ranging (1D Chart)
Key Levels:
Resistance levels: $0.0029, $0.0031, $0.0033
Support levels: $0.0011, $0.0009, $0.0007
LBLOCK/USD is heading to the north as the coin crosses above the 9-day moving average, aiming to touch the 21-day moving average too. The Lucky Block price must cross above this barrier before gaining additional uptrends.
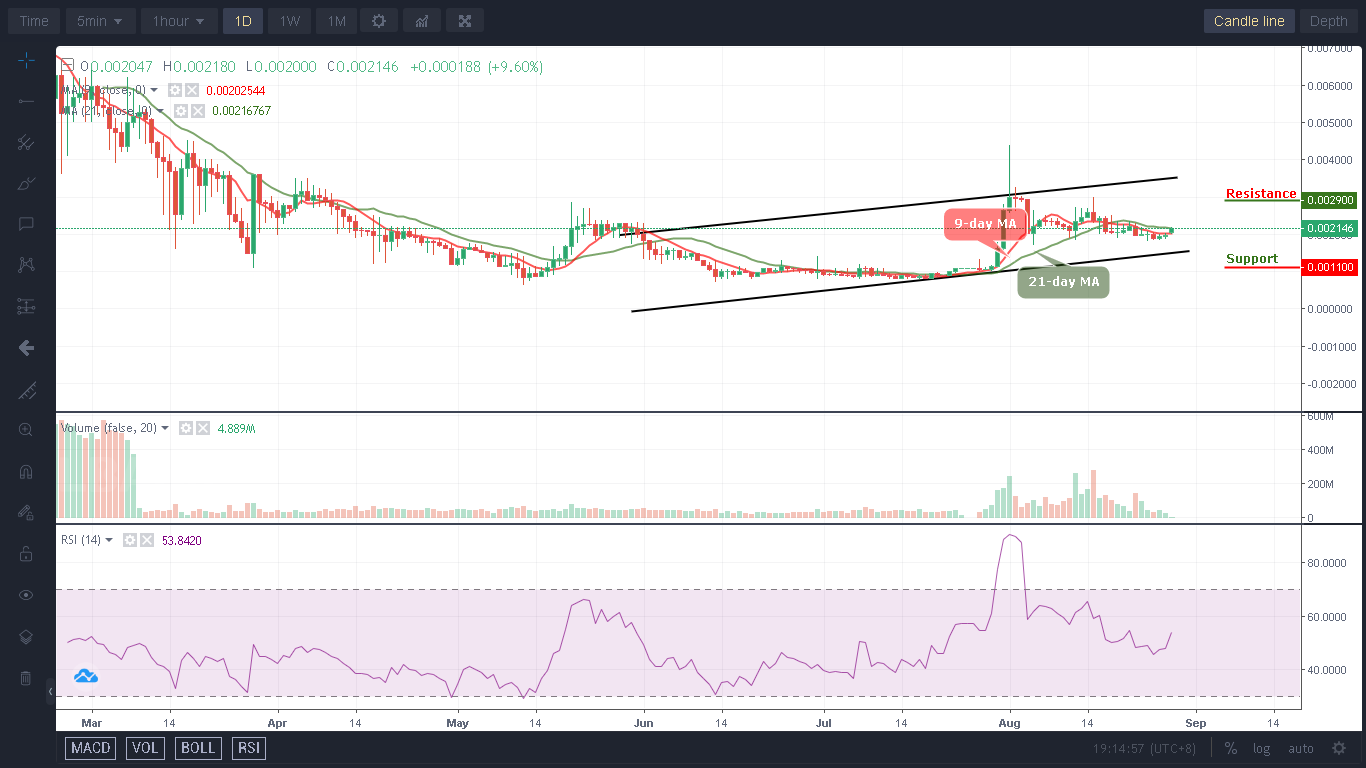
Lucky Block Price Prediction: LBLOCK/USD Begins Upward Movement
The Lucky Block price begins to move to the north as new buyers prepare to enter the market. LBLOCK/USD will cross above the 21-day moving average, and once this is done, the coin will face the north to hit the resistance levels of $0.0029, $0.0031, and $0.0033 respectively.
However, as the technical indicator Relative Strength Index (14) stays above the 50-level, the crypto would sustain the bullish movement. Meanwhile, if the coin retreats a little bit to the south, the support levels of $0.0011, $0.0009, and $0.0007 will be visited, and it will be the best time for the new investors to come into the market.
LBLOCK/USD Medium-term Trend: Ranging (4H Chart)
The Lucky Block price is in a range, and it is currently above the 9-day and 21-day moving averages. The buyers are pushing the coin to the north as the technical indicator Relative Strength Index (14) moves to cross into the overbought region.
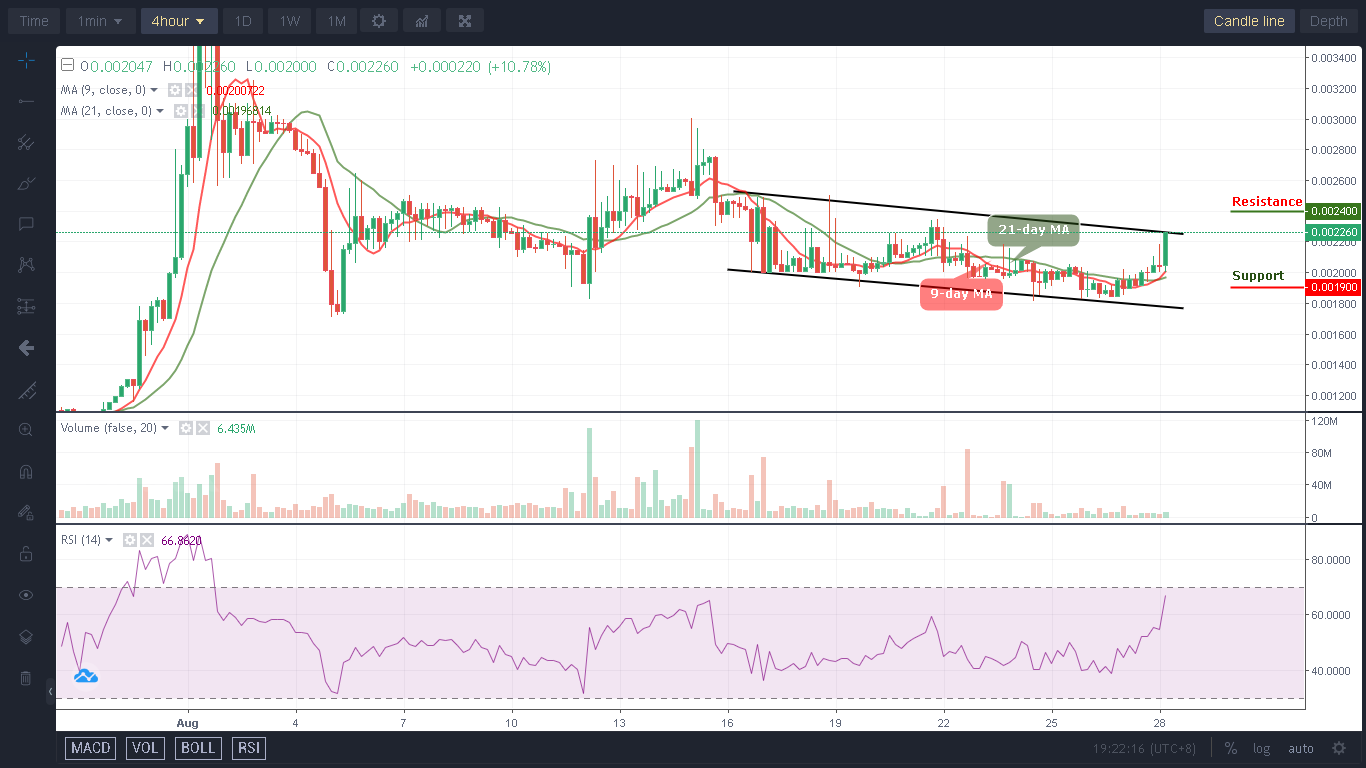
However, if the bulls succeed in pushing the price above the upper boundary of the channel, the Lucky Block will hit the resistance level of $0.0024 and above, but this might be delayed if the 9-day MA remains below the 21-day MA. In the meantime, if the market gains a few more negative moves and falls from the current value, this could bring the price below the moving averages, staying there may cause the coin to reach the support level of $0.0019 and below.
You can purchase Lucky Block here. Buy LBLOCK