Lucky Block Price Prediction: LBLOCK/USD Retreats; Opportunity to Buy the Dips
Estimated Reading Time: 3 minutes
Don’t invest unless you’re prepared to lose all the money you invest. This is a high-risk investment and you are unlikely to be protected if something goes wrong. Take 2 minutes to learn more

Free Crypto Signals Channel
The Lucky Block price is still hovering below the 9-day and 21-day moving averages as the price becomes cheaper for new buyers to invest.
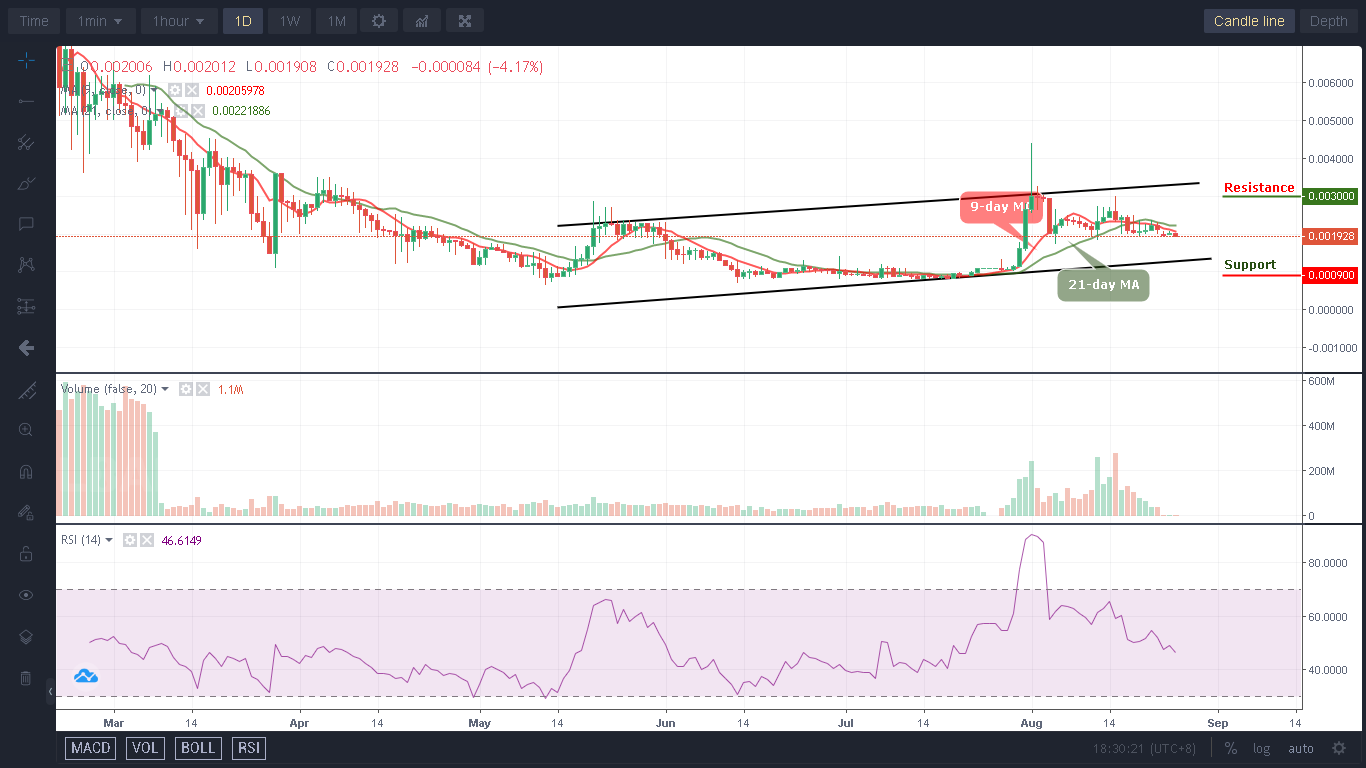
LBLOCK/USD Medium-term Trend: Ranging (1D Chart)
Key Levels:
Resistance levels: $0.0030, $0.0032, $0.0034
Support levels: $0.0009, $0.0007, $0.0005
LBLOCK/USD will be preparing for a bullish movement as the coin retreats below $0.0020. However, as soon as the coin faces the upside, it could reach the nearest resistance level of $0.0025. Meanwhile, the current movement in the market is necessary so that it could reach higher resistance levels and for new investors to come into the market.
Lucky Block Price Prediction: LBLOCK/USD Ready for a Spike to the North
At the time of writing, the Lucky Block price consolidates below the 9-day and 21-day moving averages; it would be a good opportunity for the existing buyers to buy the dip should the coin falls more. Moreover, the technical indicator Relative Strength Index (14) is still heading towards the south as any further supports could be found at $0.0009, $0.0007, and $0.0005.
On the contrary, if the buyers could hold the current market value at $0.0019 and push the market price above the 9-day and 21-day moving averages, the bulls can expect potential resistance levels to be located at $0.0030, $0.0032, and $0.0034 respectively.
LBLOCK/USD Medium-term Trend: Ranging (4H Chart)
On the 4-hour chart, the Lucky Block keeps ranging as the buyers will be coming into the market gradually. This could bring the coin to cross above the 9-day and 21-day moving averages to hit the nearest resistance at $0.0022.
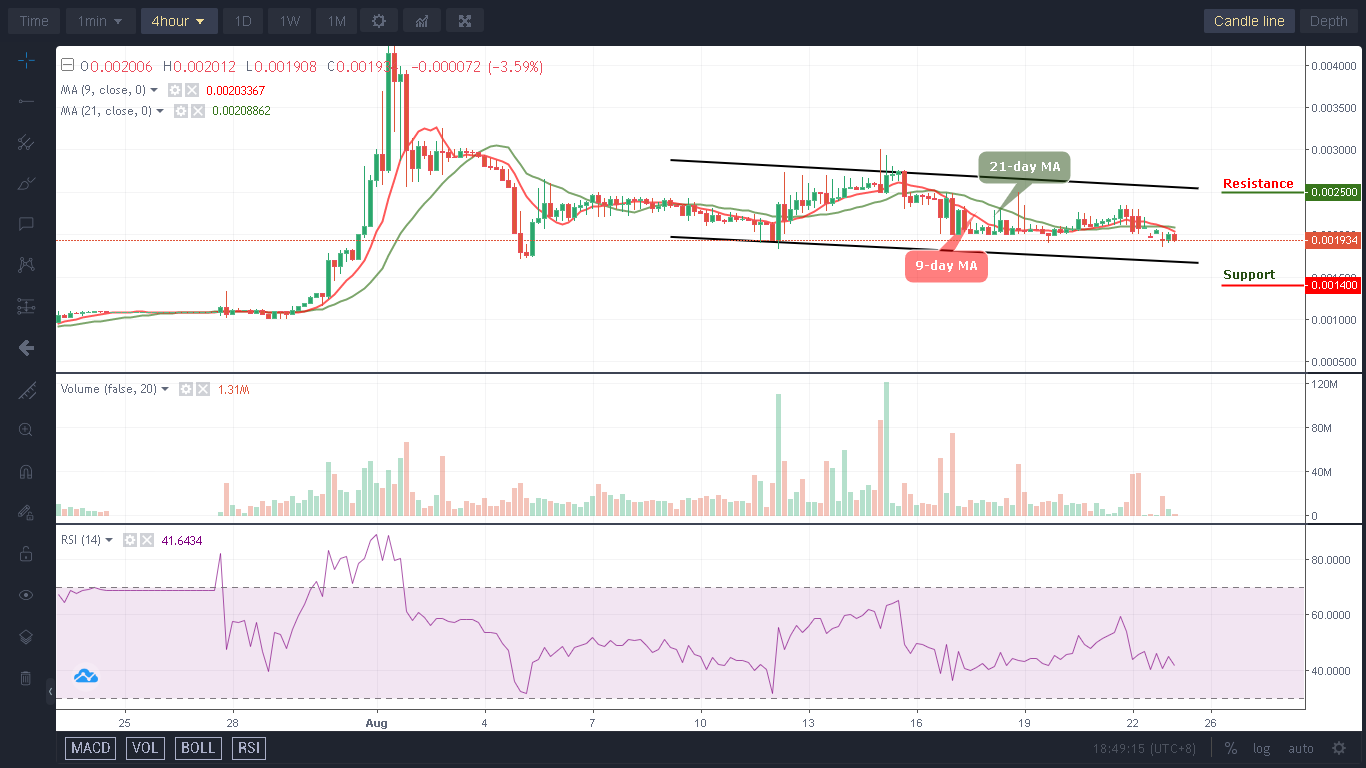
According to the chart, as the coin retreats, buyers are also getting ready to grab and push the market price towards the upper boundary of the channel; the potential resistance level could be located at $0.0025 and above. Nevertheless, if the coin decides to drop more, it could hit the support at $0.0014 and below as the technical indicator Relative Strength Index (14) moves to cross below the 40-level for more buyers to buy the dips, and the new buyers are expected to enter the market.
You can purchase Lucky Block here. Buy LBLOCK