Tamadoge (TAMA/USD) Misses $0.001 Mark, But Traders Rally Around Higher Support
Estimated Reading Time: 3 minutes
Don’t invest unless you’re prepared to lose all the money you invest. This is a high-risk investment and you are unlikely to be protected if something goes wrong. Take 2 minutes to learn more
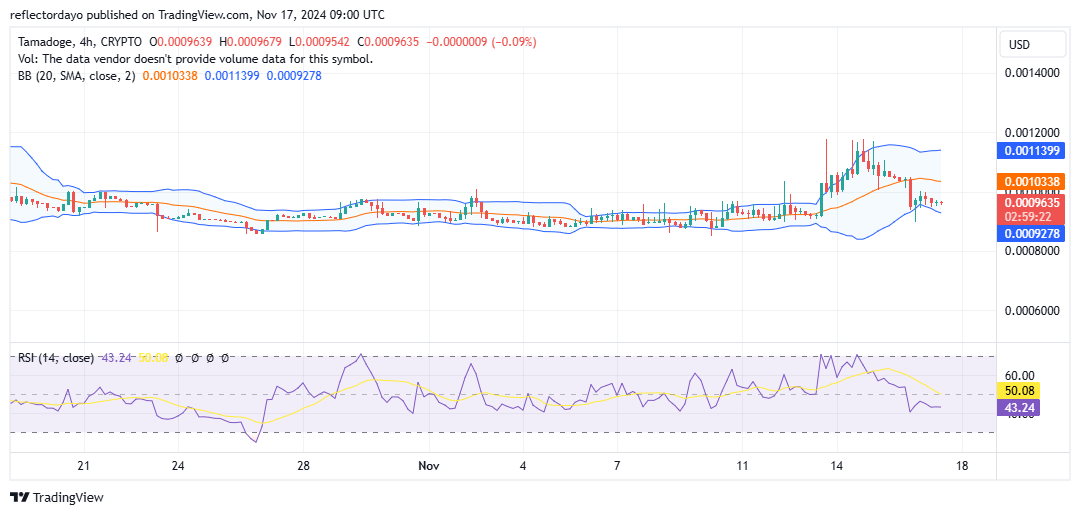
In the previous analysis of the Tamadoge market, we observed a price surge that pushed TAMA/USD above the $0.001 level, briefly reaching a peak near $0.0012. However, the market subsequently retraced, dropping below $0.001 and finding support around the $0.00095 level—a higher price floor compared to the previous support at $0.0009.
While the earlier bullish breakout increased market volatility, the bulls were unable to sustain momentum above $0.001. Despite this setback, the elevated volatility suggests that a potential rally may be on the horizon. Traders should closely monitor price action for signs of renewed upward momentum.
Key Levels
- Resistance: $0.0013, $0.0014, and $0.0015
- Support: $0.0008, $0.00078 and $0.00074
TAMA/USD Price Analysis: The Indicators’ Point of View
In the previous analysis of the Tamadoge market, we observed a price surge that pushed TAMA/USD above the $0.001 level, briefly reaching a peak near $0.0012. However, the crypto signal subsequently retraced, dropping below $0.001 and finding support around the $0.00095 level—a higher price floor compared to the previous support at $0.0009.
While the earlier bullish breakout increased market volatility, the bulls were unable to sustain momentum above $0.001. Despite this setback, the elevated volatility suggests that a potential rally may be on the horizon. Traders should closely monitor price action for signs of renewed upward momentum.
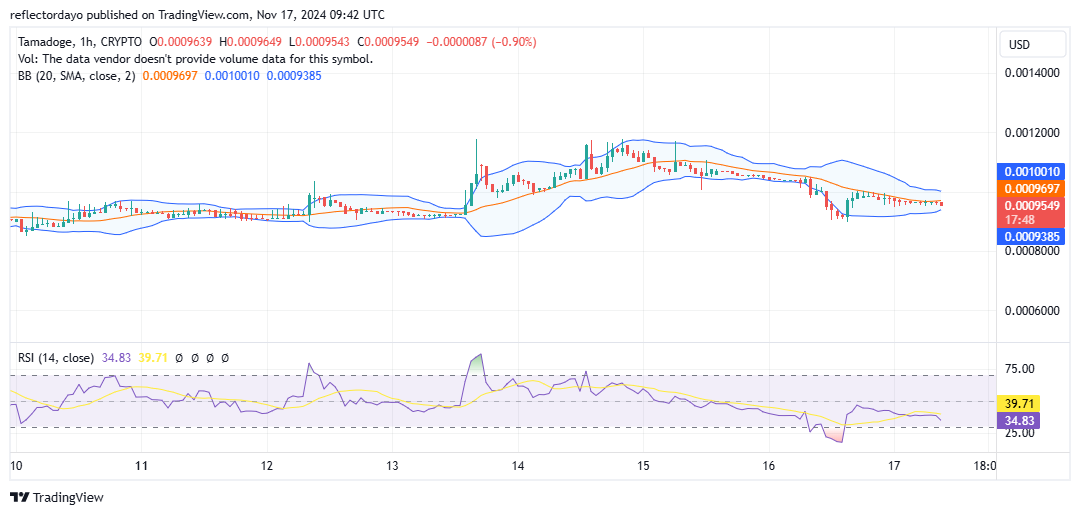
Tamadoge Short-Term Outlook: 1-Hour Chart
On the 1-hour chart, a horizontal series of doji candlesticks is evident along the $0.00095 price level, highlighting an ongoing standoff between supply and demand as traders remain uncertain about the market’s next move. This indecision is further reflected in the convergence of the Bollinger Bands, indicating reduced volatility and a decline in trading volume due to the persistent tug-of-war between buyers and sellers at this level.
Ideally, the price should maintain its position at this higher support level, avoiding a drop back to $0.0009—the previous support before the last bullish rally. Sustaining the $0.00095 level could signal a foundation for renewed bullish momentum.
Buy Tamadoge!
Fill your weekend by playing five exhilarating play-to-earn arcade games! 🕹️💰
Battle your way to the top of the weekly leaderboards and load up on $TAMA rewards!
Download on mobile now 👇
📱 Android: https://t.co/D4TjX7gTFl
📱 iOS: https://t.co/0fjJapf5oA pic.twitter.com/6MCruiKcet— TAMADOGE (@Tamadogecoin) September 13, 2024


