Polygon (POL) Price Prediction: POL/USDT Price Action Eyes the Next Technical Resistance
Estimated Reading Time: 3 minutes
Don’t invest unless you’re prepared to lose all the money you invest. This is a high-risk investment and you are unlikely to be protected if something goes wrong. Take 2 minutes to learn more

Polygon (ex-MATIC) Price Prediction November 30:
Price action in the Polygon (ex-MATIC) daily market has continued to break one technical resistance after another. At the moment, price action in the market is now in sight of the $0.6000 resistance price level. Let’s see how this may fare shortly.
POL/USDT Long-Term Trend: Bearish (Daily Chart)
Key Price Levels:
Resistance: $0.6000, $0.6500, $0.7000
Support: $0.5500, $0.5000, $0.4500
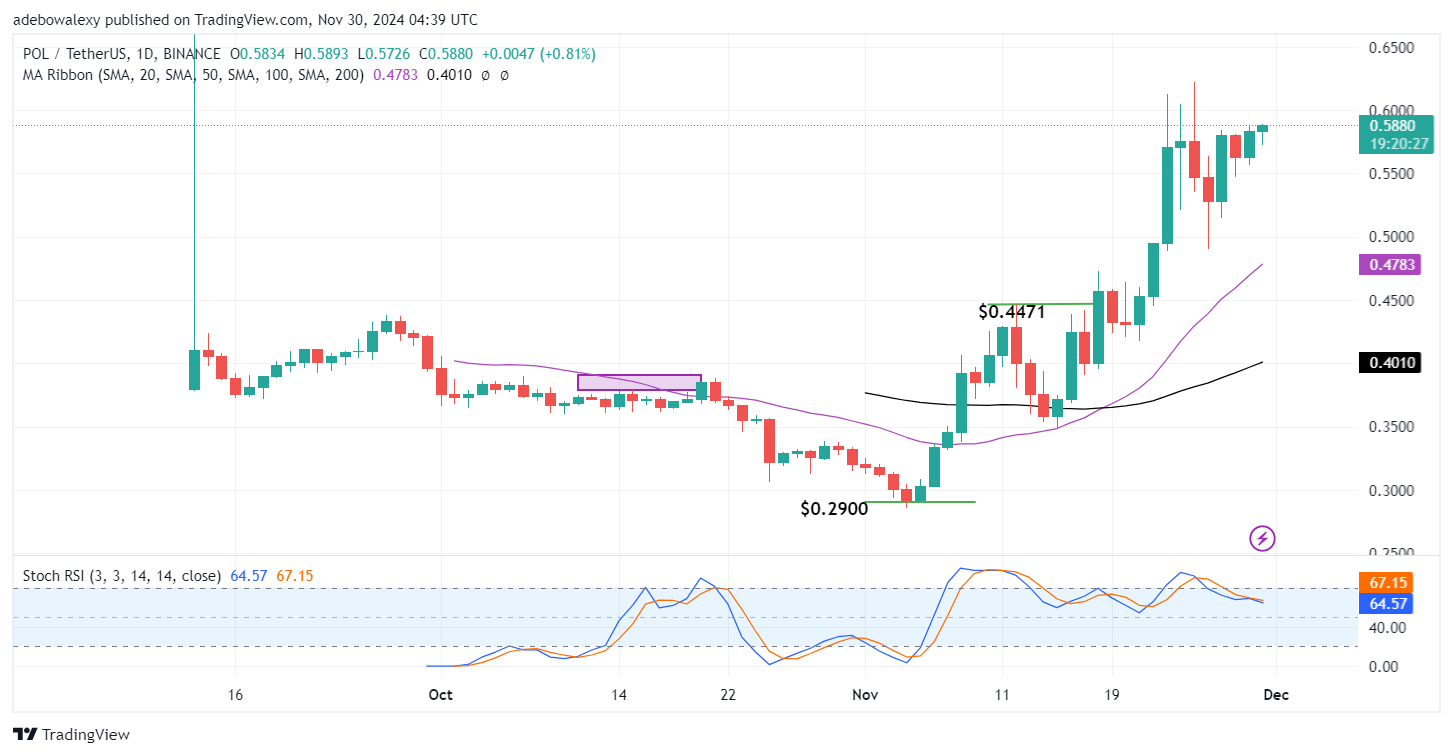
The Polygon (ex-MATIC) market continues to trade at elevated levels, a price level last seen in September. Also, the last price candle stays green while bringing further price increases to the market. As a result, this keeps the token trading above all the Moving Average (MA) lines. Meanwhile, the Stochastic Relative Strength Index (RSI) lines have a slight downward trajectory following an upside crossover.
Polygon (ex-MATIC) Price Prediction: POL/USDT Bulls Stay Hopeful
Clearly, the Polygon (ex-MATIC) can be seen still forging ahead considering price movements on the price chart. The last price candle stays green and, as such, maintains the impression that upside forces are still active. Also, it keeps the token trading at a significant distance above the MA lines on the chart.
However, the Stochastic RSI lines aren’t moving convincingly, as the lines of the indicator still have a slight downward trajectory. This seems contrary to what is happening on the price chart. As well, the movement of the indicator lines is too minimal at this point and may soon be influenced by the more notable bullish sentiment in the general market.
Polygon (ex-MATIC) Price Prediction: POL/USDT Bulls Look Set to Keep Thrusting (4-Hour Chart)
Price action in the POL/USDT market maintains an upward trajectory. Also, recent price action can be seen appearing above all the MA lines on the chart. The last price candle appeared green while standing above all the MA lines on the chart. Similarly, the Stochastic RSI lines can be seen rising steeply upward into the overbought region of the indicator.
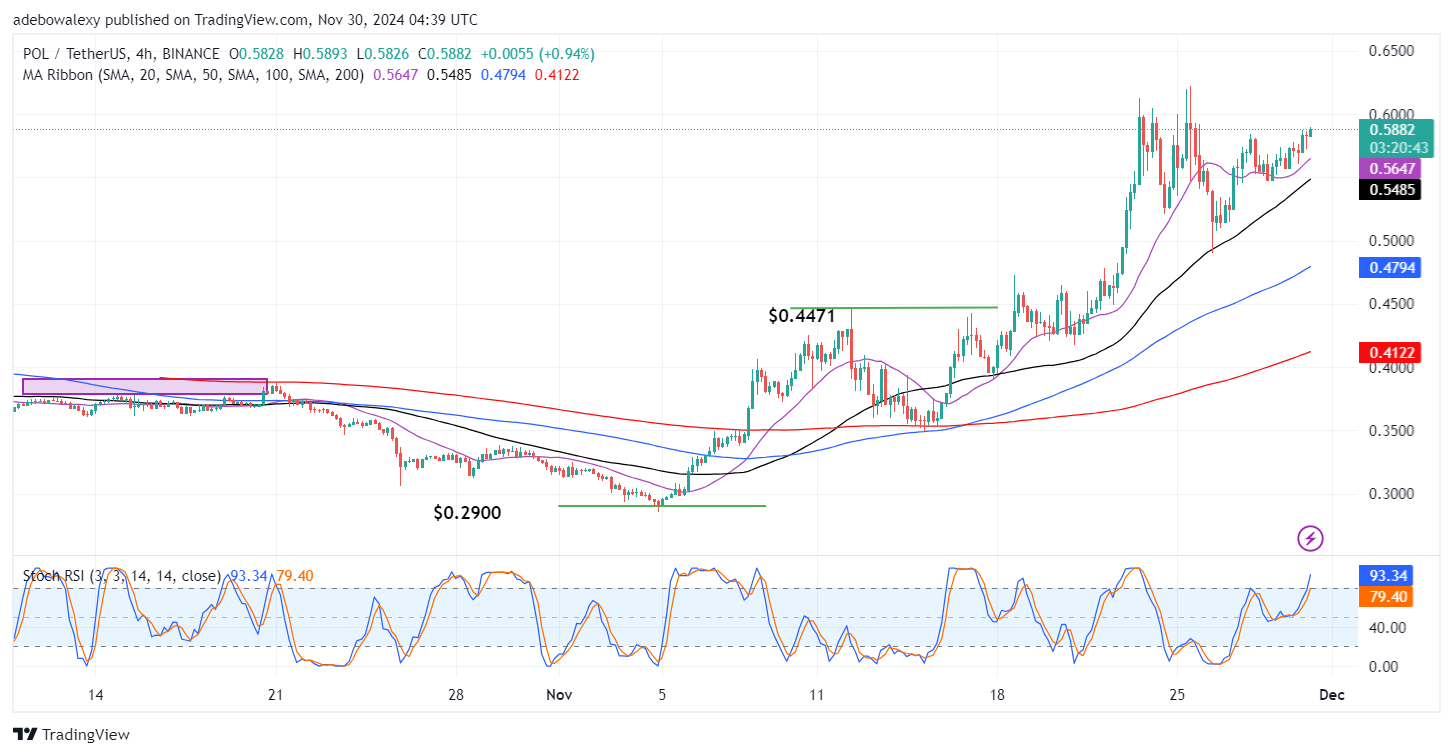
Indications arising from this price chart strongly maintain the impression that upside forces are ready to keep propelling the market. Already, the last price candle hints that upside forces are in the lead in the ongoing session. Meanwhile, the trajectory of the RSI indicator backs the prevailing bullish sentiment in the market. Therefore, the market may approach the $0.6250 price level in subsequent sessions.