Litecoin (LTC/USD) Price Declines, Touching a Significant Line
Estimated Reading Time: 3 minutes
Don’t invest unless you’re prepared to lose all the money you invest. This is a high-risk investment and you are unlikely to be protected if something goes wrong. Take 2 minutes to learn more
Litecoin Price Prediction – September 21
The LTC/USD price declines, touching a significant line at $150 during the recent volatility. The crypto market’s percentage rate is around 2.38 positive, trading around the level of $160 as of the time of writing. The overall assumption now backs that the market will soon be witnessing potential upsides.
LTC/USD Market
Key Levels:
Resistance levels: $200, $240, $280
Support levels: $140, $120, $100
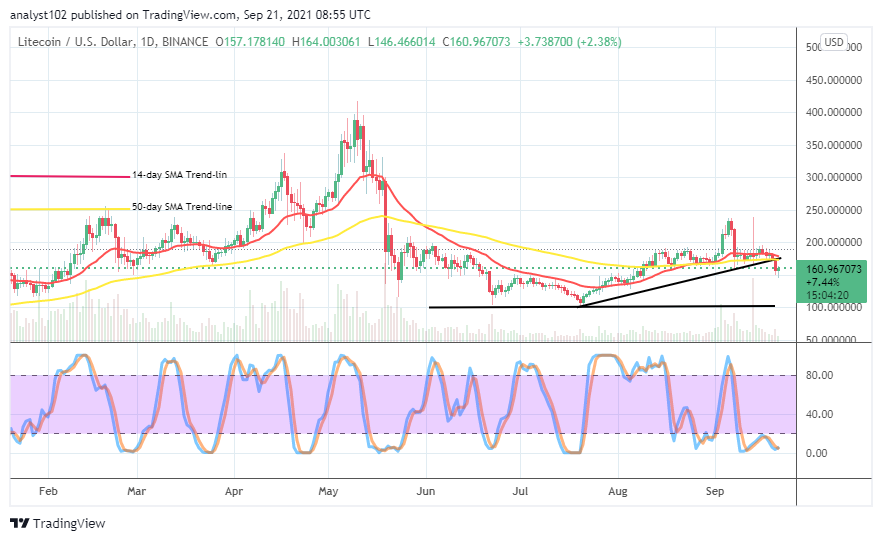
LTC/USD – Daily Chart
The LTC/USD daily chart reveals that the crypto-economic price declines, touching a significant line, hovering around the trend line of the smaller SMA. The 14-day SMA indicator briefly bends southward to touch the 50-day SMA trend line at a closer range at the top. The bullish trend line drew in a supportive manner beneath the SMAs. The Stochastic Oscillators are in the oversold region, swinging the lines in a consolidation mode to affirm that the effect of the decline is somewhat yet to be over.
Has the LTC/USD market found stable support as price declines, touching a significant line?
It seems that $150 is stable support for the LTC/USD market bulls as the price declines, touching a significant line. The value line may as well still witness price motions characterized by smaller candlesticks, depicting short-ups and short-downs. Nonetheless, it is expectantly bulls should make every effort to surge more visibly from the lower trading zone in the subsequent active operations of the crypto economy. Like wisely, investors may deem it fit as an opportunity to make another come-back into the market.
On the downside, it has indicated that the LTC/USD market bears now have to be much warier of launching positions further at the present trading capacity. The Stochastic Oscillators have dipped down into the oversold region, raising the suggestion that the USD may soon lose momentum. Therefore, bears may have to suspend coming into the market for a while. The breaking of the $150 line to the south may lead to a trap for shorting positions around that point in no time.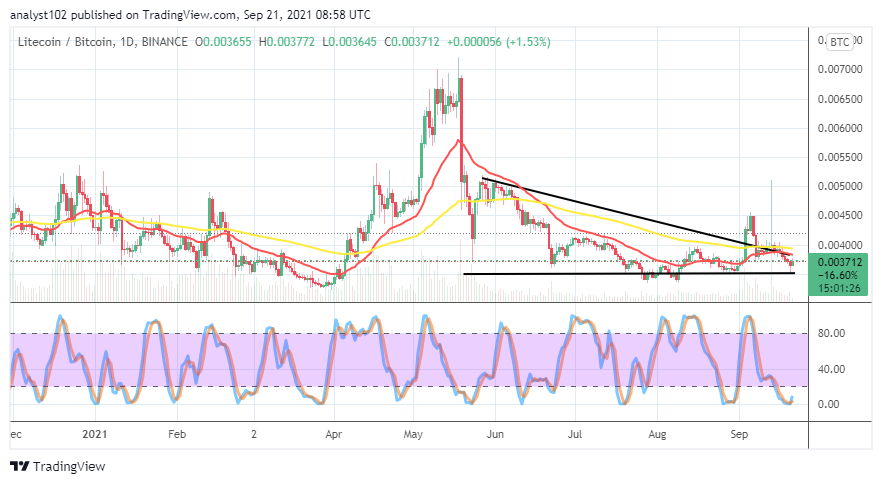
LTC/BTC Price Analysis
The LTC/BTC price analysis chart reveals that price declines, touching a significant line beneath the indicators. In a more explanatory comparison, the base crypto is overwhelmed by the flagship counter crypto to some extent. However, it is now seemingly getting to the extreme of letting Litecoin regain its lost energy as paired with BTC. The 50-day SMA indicator is over the 14-day SMA indicator. The Stochastic Oscillators have moved southbound to touch the range line at zero. That signifies that the former crypto is preparing to push against the latter crypto in the near time.
Note: Cryptosignals.org is not a financial advisor. Do your research before investing your funds in any financial asset or presented product or event. We are not responsible for your investing results.
You can purchase crypto coins here. Buy Tokens