Tamadoge (TAMA/USD) Price Swings Wildly Around the Critical $0.0042 Level
Estimated Reading Time: 3 minutes
Don’t invest unless you’re prepared to lose all the money you invest. This is a high-risk investment and you are unlikely to be protected if something goes wrong. Take 2 minutes to learn more
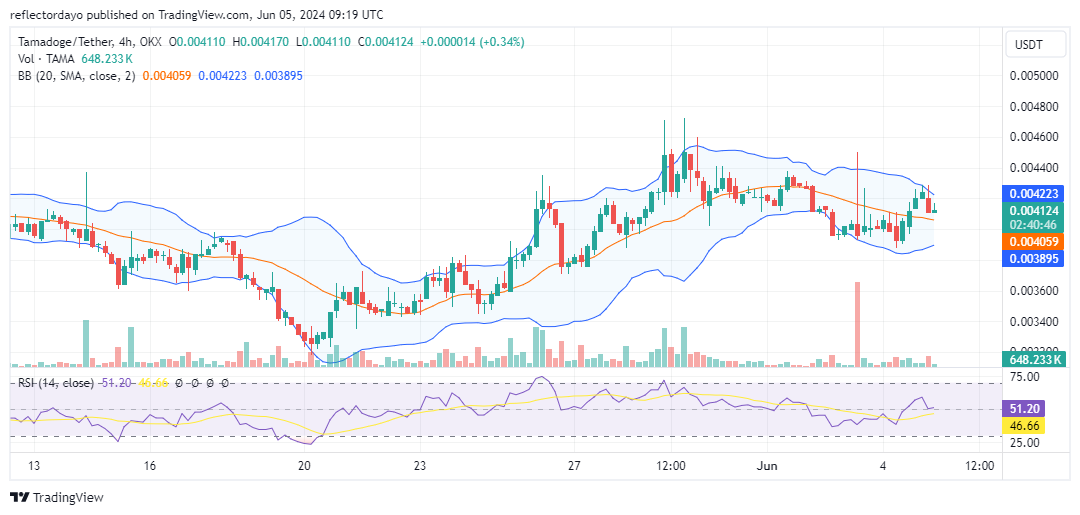
In our latest analysis of the Tamadoge market, we observed a surge in price action near the $0.0046 level, triggering a substantial bearish bias from the high of $0.0047. This take-profit frenzy caused the price to turn downward, hitting a support level at $0.0042, where the last bullish run had initiated. As the selling continued, the price fell to $0.004. However, bullish sentiment at this new level has been much stronger, sending the price back up to the critical $0.0042 level, suggesting the market may be preparing for another bull run.
Key Levels
- Resistance: $0.013, $0.014, and $0.015.
- Support: $0.0035, $0.0030, and $0.0025.
TAMA/USD Price Analysis: The Indicators’ Point of View
After hitting the $0.004 level, the price action turned upward, although a bearish bias remains in the market. The Bollinger Bands are still indicating a downward-trending price channel. However, after the price action hit strong support at the $0.004 level, the lower standard deviation curve is starting to turn upward, while the upper standard deviation and 20-day moving average continue to trend downward. This shift suggests that the price could not be sustained at the critical $0.0042 level. Bears seem to be attempting to push the price action below this level. However, around the $0.0041 level, bulls appear to be trying to establish a support level. This is evident as an inverted hammer is appearing beside the bearish candlestick, indicating growing bullish momentum, which is pushing the price upward toward the $0.0042 level.
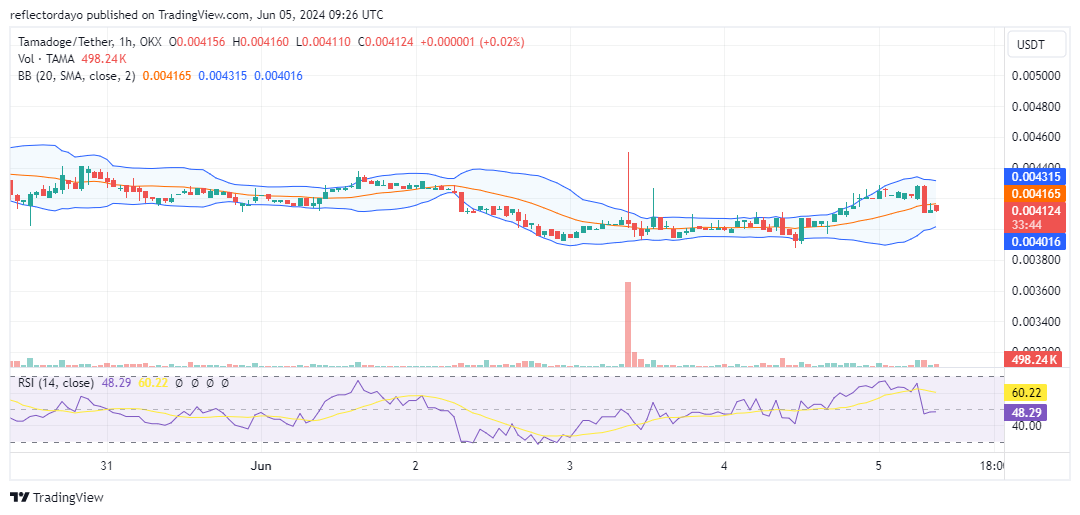
Tamadoge Short-Term Outlook: 1-Hour Chart
From this standpoint, we observe that the bulls initially maintained a position above the $0.0042 level. However, a massive selloff in the Tamadoge market, possibly a residue of the previous take-profit frenzy, caused the price to break down, with bearish momentum dominating the seventh-hour trading session and bringing the price down to around $0.0041. The price action is now retracing upward, attempting to break out above the $0.0042 resistance level. However, according to this crypto signal, bearish resistance appears to be currently holding at this level.
Buy TAMA/USD!
#Tamadoge Tuesday with Pursuit! 🚨
Race through different types of levels 🏃♂️
Spot them bones and dodge the obstacles ☠️
Get rewarded with $TAMA 🏆
Play now or forever hold your peace 😜 #P2E
Download:
📱Android: https://t.co/Of8SYALRzL
📱 iOS: https://t.co/IthvqovwAH pic.twitter.com/r4fXWr0P5Q— TAMADOGE (@Tamadogecoin) June 4, 2024
Do you want a coin that will be 100 times more valuable in the next few months? That is Tamadoge. Buy TAMA today!