Ethereum (ETH/USDT) Staged a Strong Bullish Comeback After Weeks of Prolonged Pressure
Estimated Reading Time: 3 minutes
Don’t invest unless you’re prepared to lose all the money you invest. This is a high-risk investment and you are unlikely to be protected if something goes wrong. Take 2 minutes to learn more
Ethereum Long-term Analysis: Bullish
The market for Ethereum against the Tether has experienced a strong bullish bounce this week, closing remarkably above $2,537 despite the bearish pressure below $2,300 in the previous sessions. However, this rebound comes amid broader market hope fueled by crypto institutional interest as major altcoins see an improvement to the north.
Recently, the pair opened at $2,514 for the week, recording 0.92% gains as indicators signal more gains ahead. However, a low-to-medium trend reversal may hit the market as the Stochastic RSI operates above the 80 level.
Currently, Ethereum trades at $2,537.70 with 3.22 traded volumes for the week.
Technical Indicators
Major Resistance Levels: $2,591.89, $2,771.80, and $2,900
Major Support Levels: $2,450.95, $2,350.33, and $2,100
Ethereum Technical Analysis
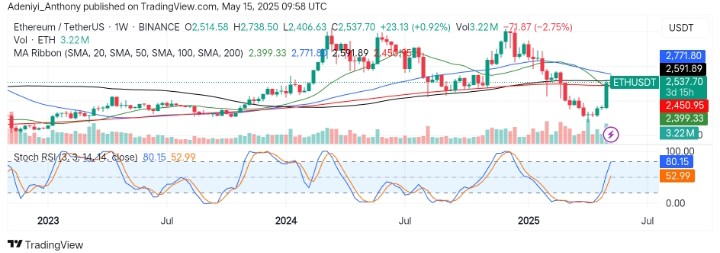
The analysis of Ethereum against the Tether on the weekly chart shows that the pair has broken back above the 20-week and 50-week simple moving averages, signaling a clear bullish attempt in months. However, the aggressive green candle shows strong buyers’ interest as volume seems unstable.
On the other hand, the Stochastic oscillator suggests more improvement to the north as the lines move upward sharply. However, if the pair’s price can sustain above $2,500, a new higher-low structure may form. Conversely, the Stochastic RSI suggests an overbought condition, raising concerns about cooling off or possible retracement back to the breakout area in the near term.
ETH/USDT Analysis: Reclaiming the Bull Zone
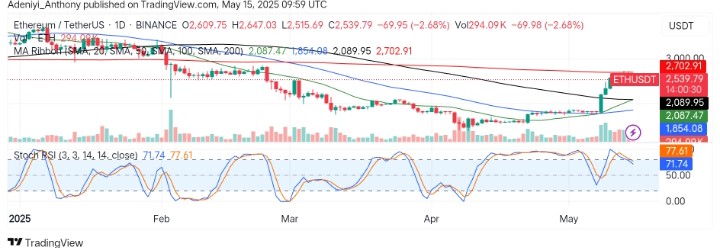
On the daily timeframe, ETH/USDT in recent times has shown a sharp rally, breaking through 20, 50, and 100 SMAs with strong bullish momentum. However, the price is currently stalling below the critical 200-period SMA at $2,702.91, suggesting a potential rejection zone.
From another angle, the Stochastic RSI signals bullish momentum is waning as the lines return to the 70-mark level, suggesting a possible return towards the previous demand zone as the volume remains unstable.
To this end, if the price can hold above the $2,450 zone with increased volume, a break above $2,900 may be possible; otherwise, movement towards $2,087 may be unavoidable.
You can purchase crypto coins here. Buy LBlock