Ethereum (ETH/USDT) Eyes Recovery as Bullish Momentum Builds
Estimated Reading Time: 3 minutes
Don’t invest unless you’re prepared to lose all the money you invest. This is a high-risk investment and you are unlikely to be protected if something goes wrong. Take 2 minutes to learn more

Ethereum Long-term Analysis: Bullish
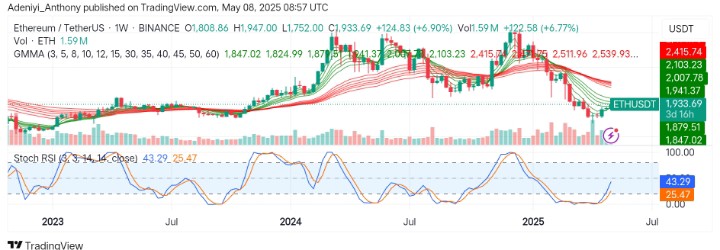
Recently, the market for Ethereum against the Tether has rebounded from a critical $1,800 support zone, reflecting early signs of bullish reversal after a prolonged weekly downtrend. However, as it stands, the pair has seen a 6.9% weekly gain combined with improving volume, suggesting confidence among the bullish traders.
To this end, more participation and improvement above the $2,000 is needed to confirm recovery moves in the coming weeks.
Currently, Ethereum trades at $1,933.69 with 1.59 million traded volumes for the week.
Technical Indicators
Major Resistance Levels: $2,000, $2,415, and $2,540
Major Support Levels: $1,847, $1,752, and $1,600
Ethereum Technical Analysis
The analysis of Ethereum against the Tether on the weekly timeframe shows that a potential trend reversal from a prolonged corrective downtrend is about to unfold after bouncing off the $1,800 multi-week low. However, the Guppy Multiple Moving Averages (GMMAs) suggest a potential consolidation before a major breakout as the short-period EMAs converge to the north while the long-term EMAs are flattened.
From another side, the Stochastic RSI and volume appear to be giving signs of impending improvement. However, a break above $2,000 in the near term is sacrosanct to the confirmation of this move; otherwise, range-bound activities may materialize.
ETH/USDT Analysis: Where from Here?
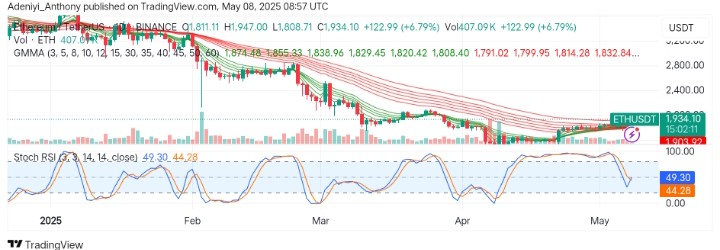
On the daily chart, ETH/USDT appears to have broken a short-term descending trendline, displaying a strong bullish candle. However, the price seems to be pressing upward as the sets of EMAs prepare for upside transitioning.
From another angle, the oscillator signals a renewed upside interest as an increase in daily volume confirms buy-side participation in the breakout attempt.
To this end, if momentum is sustained above the $2,000 resistance level, more gains would be recorded, otherwise, a pullback towards previous support Level may be seen.
You can purchase crypto coins here. Buy LBlock