Polkadot Holds above $23 Support, Unable to Break $28 High
Estimated Reading Time: 2 minutes
Don’t invest unless you’re prepared to lose all the money you invest. This is a high-risk investment and you are unlikely to be protected if something goes wrong. Take 2 minutes to learn more

Polkadot (DOT) Long-Term Analysis: Bearish
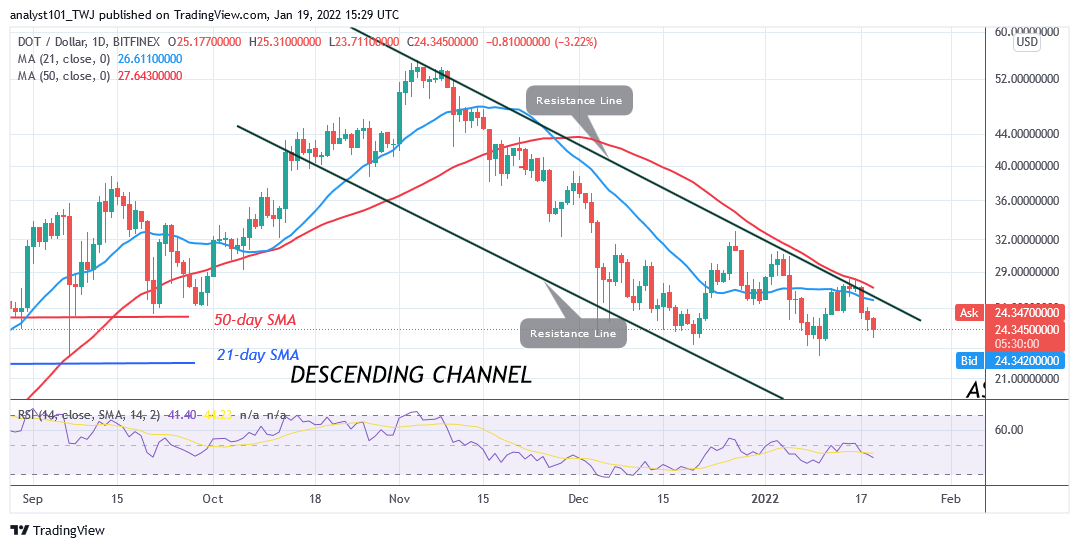
Polkadot’s (DOT) price has continued its downward move but unable to break $28 High. On December 27 rejection, Polkadot has been in a downward move. DOT’s price has been making a series of lower highs and lower lows. The downtrend has made a lower high of $32, $30, and $28. The recent lower high of $28 has been known.DOT price is falling to reach a lower low. Meanwhile, Polkadot is approaching the previous low of $23. The previous low of $23 is the price level of the December 4 price slump. The $23 support has not been broken since December 4, 2021. DOT price will reach the low of $18 if the current support is breached.
Polkadot (DOT) Indicator Analysis
The crypto is at level 41 of the Relative Strength Index for period 14. Polkadot is in the downtrend zone and below the centerline 50. DOTprice bars are below the moving averages indicating a possible fall of the coin. DOT price is below the 40% range of the daily stochastic. The market is in a bearish momentum.
Technical indicators:
Major Resistance Levels – $48, $52, $56
Major Support Levels – $32, $28, $24
What Is the Next Direction for Polkadot (DOT)?
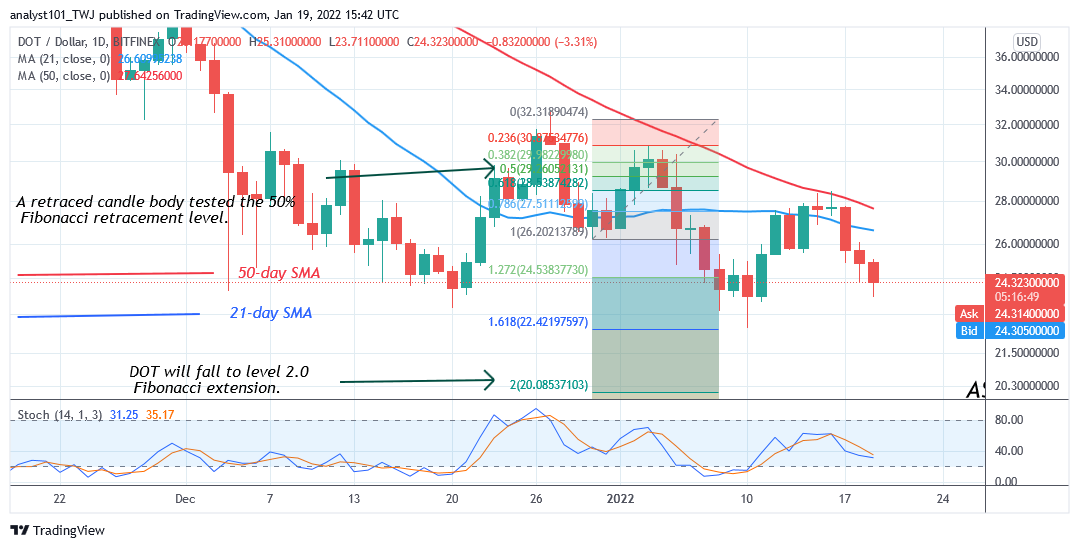
On the 4 –hour chart, the crypto is in a downward move but unable to break $28 high. Today, the market is falling because of the rejection at $28. Meanwhile, on December 30 downtrend, a retraced candle body tested the 50% Fibonacci retracement level. The retracement indicates that DOT price will fall to level 2.0 Fibonacci extension or $20.08.
You can purchase crypto coins here. Buy Tokens
Note: Cryptosignals.org is not a financial advisor. Do your research before investing your funds in any financial asset or presented product or event. We are not responsible for your investing results