SPONGE/USD ($SPONGE) Bulls Prepare for Action
Estimated Reading Time: 3 minutes
Don’t invest unless you’re prepared to lose all the money you invest. This is a high-risk investment and you are unlikely to be protected if something goes wrong. Take 2 minutes to learn more
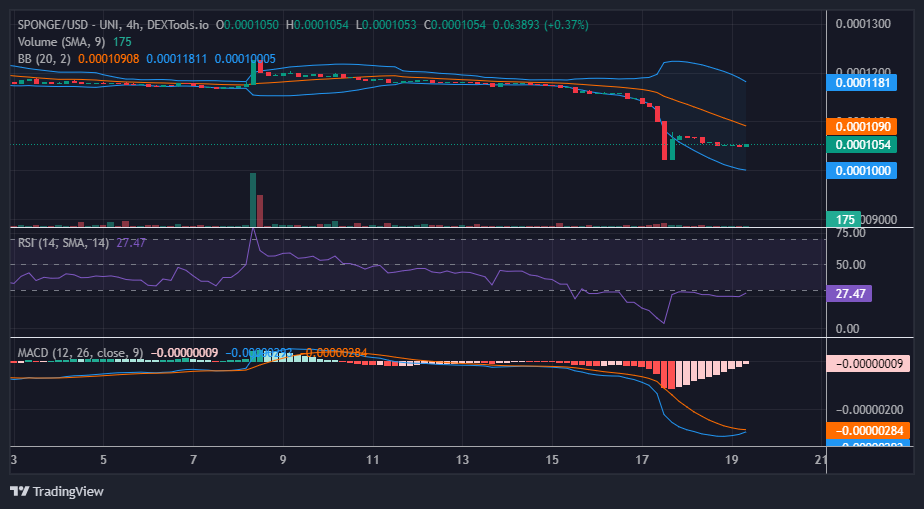
Following the SPONGE/USD bear market that pushed the price inches closer to the $0.00010 price level, it encountered a substantial obstacle at the $0.0001022 price level. As a result, the market started to rebound, marking a noteworthy recovery. However, the bears regrouped when the price reached the $0.0001071 level, exerting pressure on the bulls’ position and compelling them to seek support at $0.0001050. This recent shift in the market could induce uncertainty as the price channel narrows due to the proximity of demand and supply.
Key Levels
- Resistance: $0.0004, $0.0045, and $0.0005.
- Support: $0.00011, $0.00010, and $0.00009.
Sponge (SPONGE/USD) Price Analysis: The Indicators’ Point of View
There haven’t been many changes in the SPONGE/USD market since the previous daily trading session. The market continues to remain in oversold territory, a condition evident through both the Bollinger Bands and the Moving Average Convergence and Divergence (MACD) indicators. Despite this, the MACD indicator shows some potential as the negative histograms are gradually shifting from deep red to a lighter hue, accompanied by a diminishing height. This suggests a forthcoming transition towards the positive side of the indicator.
Additionally, the MACD indicator is on the verge of a bullish crossover below the zero level. This could indicate a buildup of momentum, possibly signaling the development of a bullish trend.
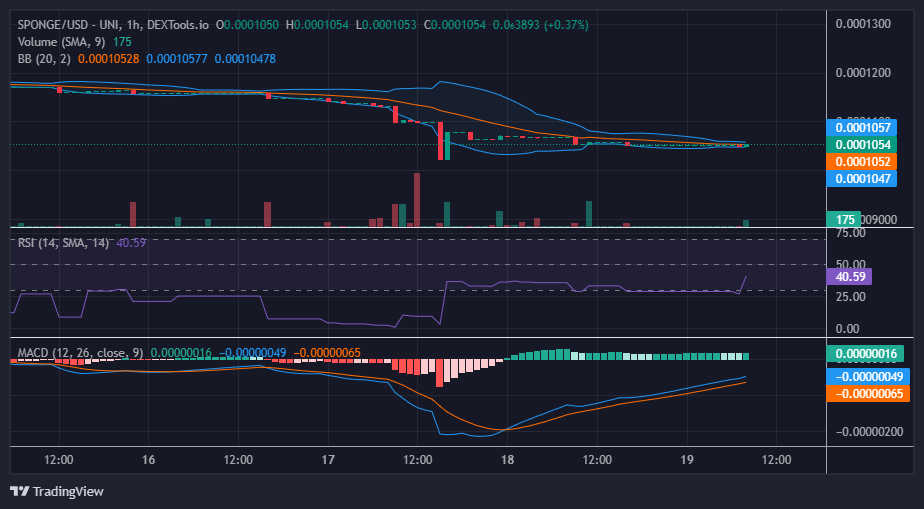
$SPONGE Short-Term Outlook: 1-Hour Chart
The Bollinger Bands indicator currently indicates a pronounced volatility squeeze. Simultaneously, as the Bollinger Bands constrict around the horizontally moving price actions, the two MACD lines within the Moving Average Convergence and Divergence have demonstrated recovery. The MACD lines are about to rally out from below the zero level, but the price action remains extremely flat. This, however, still constitutes a robust supportive signal for a potential bullish recovery. This occurrence could suggest that buying pressure is intensifying despite the outwardly subdued appearance of the market.
Buy $SPONGE and soak up the damp.
It really be like that… 😄😂👌 pic.twitter.com/BD6TxOoaQT
— $SPONGE (@spongeoneth) August 19, 2023
Invest in the hottest and best meme coin. Buy Sponge ($SPONGE) today!