Ethereum (ETH/USDT) Eyes Reversal as Bulls Defend Critical Support Zone Near $1,700
Estimated Reading Time: 3 minutes
Don’t invest unless you’re prepared to lose all the money you invest. This is a high-risk investment and you are unlikely to be protected if something goes wrong. Take 2 minutes to learn more
ETH Long-term Analysis: Bullish
The market for Ethereum against the Tether is showing early signs of a potential rebound to the North after weeks of selling pressure. The pair seems to have found a strong footing near a weekly support level as the coin sees positive movement.
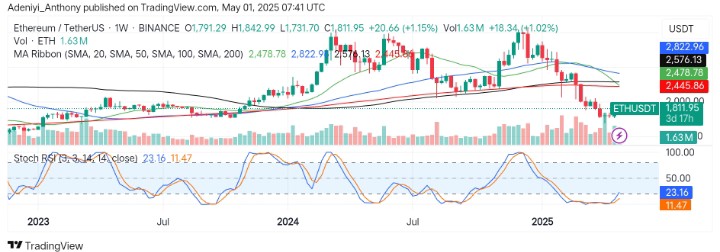
Recently, the pair has been moving to the south, retracing from around $4,000 below the $1,800 region. However, current price action shows the pair is testing a key support zone below the 200-week moving average, accompanied by an oversold situation on the Stochastic RSI. To this end, the weekly volume suggests selling pressure is waning, pointing at a potential accumulation as the pair prepares for a bounce.
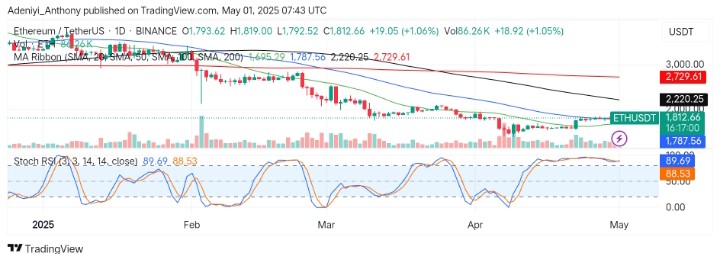
Currently, Ethereum trades at $1,811.95, recording a moderate 1.63 million traded volume for the week.
Technical Indicators
Major Resistance Levels: $2,445, $2,500, and $2,800
Major Support Levels: $1,780, $1,550, and $1,400
Ethereum Technical Analysis
The analysis of Ethereum against Tether on a weekly chart shows the pair is currently acting under the moving average ribbons with the likelihood of breaking above the 200-week simple moving average.
From another angle, the momentum oscillator suggests an upside movement for the pair in the near term as the lines curl upside from the oversold region. To this end, as volume begins to stabilize, the market may see a decline in seller pressure and a potential move above $2,445.
ETH/USDT Analysis: What’s Next?
On the daily timeframe, ETHUSDT appears to be strengthening moves on the weekly chart as the price struggles to hold above the 50-day SMA with the 20-day below. However, volume remains steady, suggesting early accumulation rather than aggressive buying.
On the other hand, the oscillator shows the pair is overbought with the lines still pointing north. This suggests the pair has room for improvement with the possibility of a short-term pullback.
To this end, if bullish momentum is sustained above the $1,800 psychological level, a potential shift in trend may be seen with the next target being $2,220.
You can purchase crypto coins here. Buy LBlock