Ethereum (ETH/USDT) Faces a Make-or-Break Situation as Support Weakens
Estimated Reading Time: 3 minutes
Don’t invest unless you’re prepared to lose all the money you invest. This is a high-risk investment and you are unlikely to be protected if something goes wrong. Take 2 minutes to learn more

Ethereum Long-term Analysis: Bearish
The market for Ethereum against the Tether in the earlier cycles has shown a strong bullish momentum. However, the pair seems to be under strong bearish pressure, with the price operating under the Moving Average Ribbons.
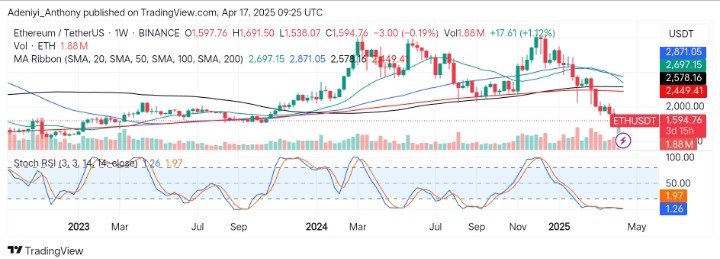
Recently, Ethereum has been positioned at a critical level, dropping below the 20, 50, 100, and 200 simple moving averages with a low traded volume, hinting at a weakened bullish participation. However, the Stochastic RSI levels suggest the possibility of a short-term bounce as the traders await a surge in the price of the pair or a move towards $1,300 in the near term.
Currently, Ethereum trades at $1,594.76 with 1.88 million traded volumes.
Technical Indicators
Major Resistance Levels: $2,000.00, $2,449.00, and $2,871.00
Major Support Levels: $1,500.00, $1,420.00, and $1,300.00
Ethereum Technical Analysis
The analysis of Ethereum against the Tether on a weekly timeframe shows that the market has a tendency to move in either direction. However, the positioning of the price under the simple moving averages suggests bearish dominance, as indicated by the price movement and low market volumes.
Beneath the chart, the Stochastic RSI shows the pair is oversold as signaled by the lines at $1.97 and 1.26 but holds the potential of experiencing a short-term bounce to the north.
To this end, if the Stochastic oscillator’s lines curl towards the 30-mark level, Ethereum’s value might bounce towards $1,800. Conversely, a break below $1,500 would push the price towards $1,300.
ETH/USDT Analysis: Will the Bulls Return?
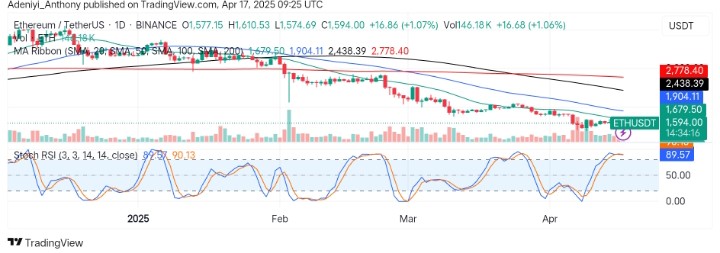
On the daily chart, ETH/USDT appears to be forming a temporary base around the $1,600 level. However, the oscillator under the chart signals an overbought condition, suggesting a potential pullback is on the horizon.
From another angle, despite the minor upward movement in recent times in this timeframe, the pair remains below all moving averages, reinforcing bearish pressure. To this end, a clear break above $1,600 would suggest the bullish determination to break above $1,800 in this session; otherwise, the pair might visit the $1,300 level if the bulls fail to sustain the upside movement.
You can purchase crypto coins here. Buy LBlock