Ethereum (ETH/USDT) Poised for a Long-term Potential Reversal Amid Bearish Pressure
Estimated Reading Time: 3 minutes
Don’t invest unless you’re prepared to lose all the money you invest. This is a high-risk investment and you are unlikely to be protected if something goes wrong. Take 2 minutes to learn more
Ethereum Long-term Analysis: Bearish
The market for Ethereum against the Tether has dropped in price beyond critical support zones after a strong rally in the latter part of 2024. This can be seen in the operation of the pair’s price below the Moving Average Ribbons as bullish traders now hope to see a reversal in trend.
Recently, Ethereum has shown signs of exhaustion in its downtrend as the Stochastic lines extend to the front without a clear direction, suggesting a potential accumulation. To this end, the market hopes to see increased bullish pressure to reclaim immediate resistance at $2,000 for a sustained momentum to the north.
Currently, Ethereum trades at $1,596.45, recording 5.32 million traded volumes for the week.
Technical Indicators
Major Resistance Levels: $2,000, $2,452, and $2,802
Major Support Levels: $1,385, $1,300, and $1,000
Ethereum Technical Analysis
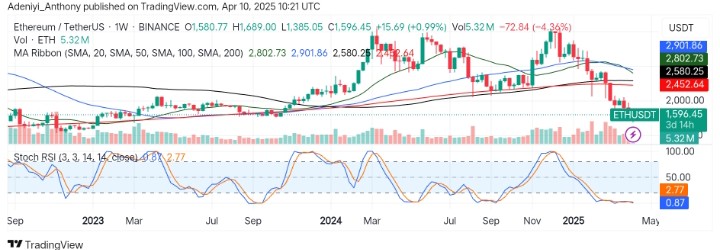
The technical analysis of Ethereum against the Tether weekly shows that the pair has been on corrective moves since hitting a local peak above $3,000 in the previous year. As it stands, the price has fallen below the 20, 50, 100, and 200 moving averages, indicating a prolonged bearish dominance.
However, the traded volume remains relatively steady, signaling strength among long-term Ethereum holders, but the bigger picture remains cautiously bearish as the Stochastic RSI shows no potential movement.
To this end, a strong bullish divergence pattern is needed to move above $2,000 for a target above the $2,452 200 SMA line; otherwise, a fall towards $1,000 might be recorded if the immediate support fails to hold.
ETH/USDT Analysis: A reversal or Continued Downtrend?
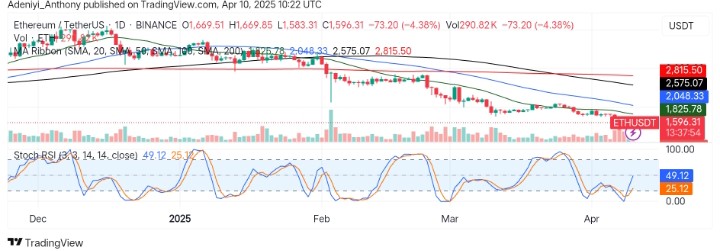
On the daily chart, ETH/USDT appears to be in a continued downtrend, confirming continued bearish control as the pair’s price continues to hover under the Moving average ribbons. The 20 SMA line at $1,825.78 seems to be declining, suggesting near-term pressure and a potential price rejection.
However, the oscillator is beginning to rise from the oversold zone, hinting at a possible short-term bounce as volume accumulates.
To this end, a close above $1,825 would signal a shift in momentum towards reclaiming the $2,000 level; otherwise, failure to hold the current level may invite further downsides.
You can purchase crypto coins here. Buy LBlock