SPONGE/USD ($SPONGE) Still Holds the Possibility of Upward Price Action
Estimated Reading Time: 3 minutes
Don’t invest unless you’re prepared to lose all the money you invest. This is a high-risk investment and you are unlikely to be protected if something goes wrong. Take 2 minutes to learn more
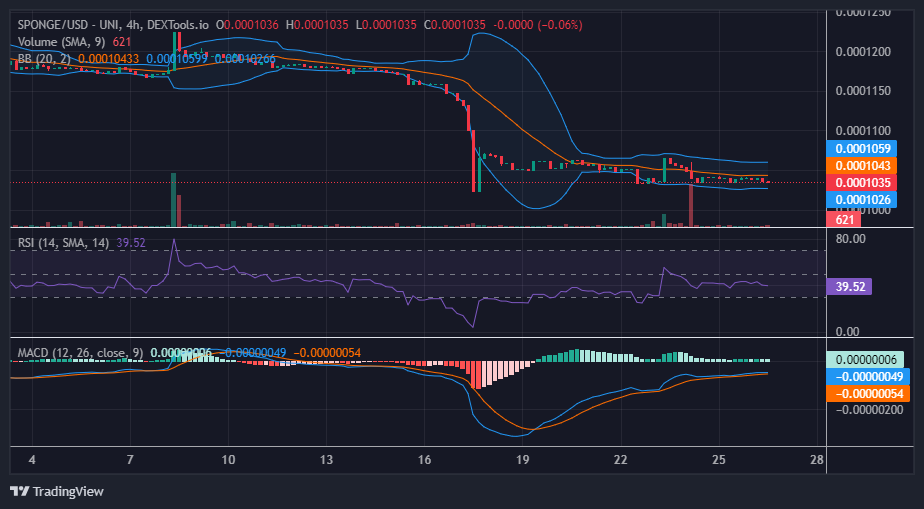
In this technical analysis, we will examine the current state of the SPONGE/USD market. The market has exhibited continued stagnant behavior since the last analysis, with minimal changes in price action. The price is still hovering around the $0.0001035 level, indicating a strong consolidation phase.
The SPONGE/USD pair has maintained its sideways movement along the $0.0001035 price level. This price level appears to be a significant point of interest, as it has acted as a pivot in recent trading sessions. The market’s inability to break out of this range suggests a balance between buying and selling pressures. However, the presence of pressure on the demand level indicates potential selling interest at these levels.
Key Levels
- Resistance: $0.0004, $0.0045, and $0.0005.
- Support: $0.00011, $0.00010, and $0.00009.
Sponge (SPONGE/USD) Price Analysis: The Indicators’ Point of View
The RSI is hovering around the 40 level. This reading suggests that the SPONGE/USD market is neither significantly overbought nor oversold. The RSI’s position in this range aligns with the sideways price action, indicating a lack of strong directional momentum at the moment.
The MACD histogram is currently below the zero level, with the two MACD lines ranging sideways. This configuration reflects a lack of decisive bullish or bearish momentum in the market. The histogram’s position below zero indicates that the short-term moving average (MACD line) is below the long-term moving average (signal line), suggesting a potential bearish bias. However, the range-bound movement of the MACD lines implies a lack of conviction in either direction.
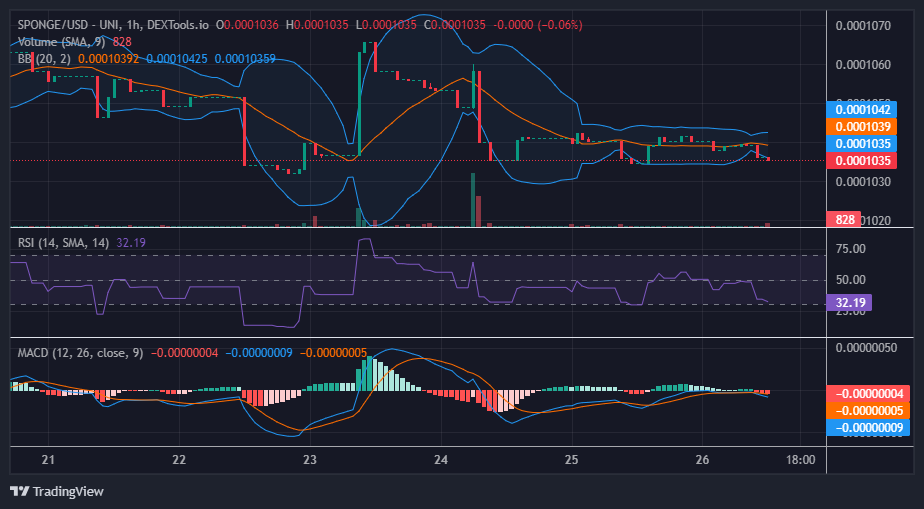
$SPONGE Short-Term Outlook: 1-Hour Chart
Looking at the 1-hour chart, it’s evident that aside from the narrowing of the Bollinger Bands, there’s a minor breakout in the price action. However, the prominent support level is significantly impeding the bear market’s advancement. If the support level persists, the market might target the $0.0001070 price level as its next potential stop.
Spend some time in the $SPONGE realm and begin trading on @gate_io.
🌊 Immerse yourself in the world of $SPONGE and start trading on @gate_io!🚀
💧Explore the ultimate #MemeCoin and absorb all the damp!🧽🌊
🔗 Dive in – https://t.co/lDGSBf8kaO pic.twitter.com/NPBHfJePB7
— $SPONGE (@spongeoneth) August 26, 2023
Invest in the hottest and best meme coin. Buy Sponge ($SPONGE) today!