Bitcoin Cash (BCH/USD) Price Devalues at $600
Estimated Reading Time: 3 minutes
Don’t invest unless you’re prepared to lose all the money you invest. This is a high-risk investment and you are unlikely to be protected if something goes wrong. Take 2 minutes to learn more
Bitcoin Cash Price Prediction – September 24
The BCH/USD price devalues at $600 after holding a variant of a range-trading situation around the levels of $800 and the point mentioned earlier. The crypto’s percentage rate is around 1.37 negative, trading around the level of $545 as of writing. Indication has it that the crypto market has entered lower trading zones.
BCH/USD Market
Key Levels:
Resistance levels: $700, $900, $1,100
Support levels: $400, $300, $200
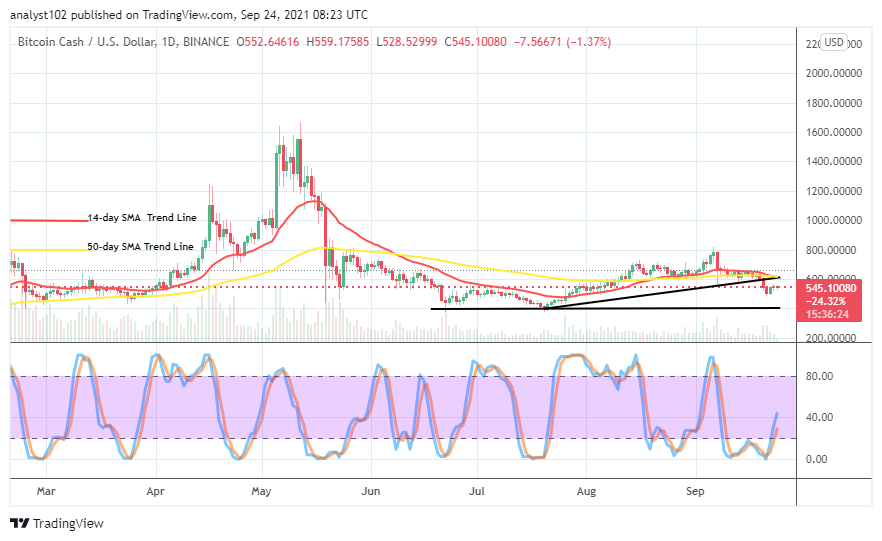
BCH/USD – Daily Chart
The BCH/USD daily chart shows that the crypto pair price devalues further around the line of $600, lately serving as the lower range line. The 14-day SMA trend line has briefly crossed southbound to touch the 50-day SMA trend line at the top. The bullish trend line drew in a supportive posture to the SMAs has been breached equally at the value-line mentioned. The Stochastic Oscillators have moved from the oversold region to point slightly past the range of 40. That signifies that upward pressure is relatively ongoing.
Will there be a continuity of trading operations beneath $600 as the BCH/USD market’s price devalues at it?
There may be a continuity of trading operations beneath the $600 level for a while as the BCH/USD market’s price devalues at it presently. As the market enters the ranges of $600 and $400, it appears that another round of taking decent long positions has come up. Like wisely, investors may as well consider adding more to their portfolios. The critical support baseline drew at $400 marks the maximal zone price tends to fall in the following sessions if a downward force has to resurface around the current trading point.
On the downside, the BCH/USD market bears presently have a flimsy stance to consolidate their presence in the crypto activities in the ranges of $600 and $400. As a result, any sign tends to pose the possibility of succumbing to a downward force within the stated range value-lines may be in other to whipsaw sell orders taken around those levels.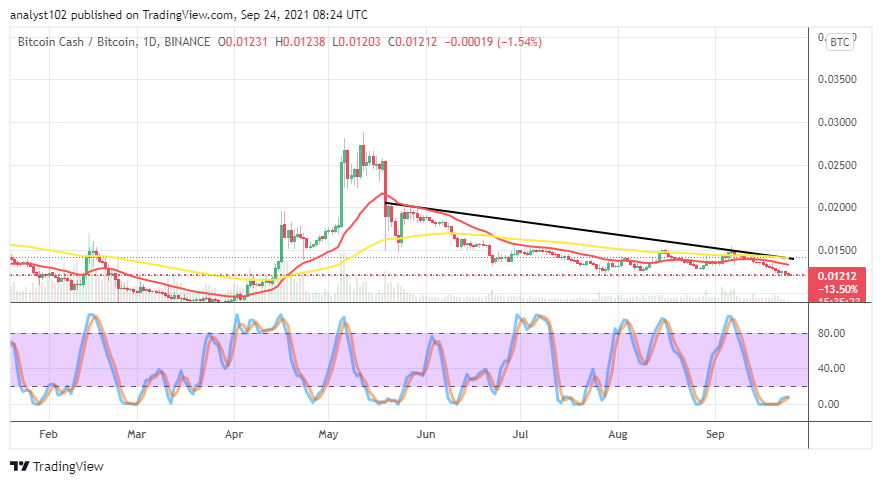
BCH/BTC Price Analysis
AUD/USD Market Heightens RetraceThe BCH/BTC price chart reveals that price devalues beneath the trading indicators. It further means that the base crypto loses somewhat in momentum as compared with the counter crypto. The 14-day SMA indicator is slightly bent southward at a closer location beneath the 50-day SMA indicator. The Stochastic Oscillators are in the oversold region with conjoined lines, seemingly moving in a consolidation manner. That could mean that the cryptocurrency pair is taking a breath from the trading condition for a while. That said, Bitcoin Cash is mostly expected to push against Bitcoin in the subsequent trading sessions.
Note: Cryptosignals.org is not a financial advisor. Do your research before investing your funds in any financial asset or presented product or event. We are not responsible for your investing results.
You can purchase crypto coins here. Buy Tokens