Bitcoin Cash (BCH/USD) Retests the $540 Resistance Level
Estimated Reading Time: 3 minutes
Don’t invest unless you’re prepared to lose all the money you invest. This is a high-risk investment and you are unlikely to be protected if something goes wrong. Take 2 minutes to learn more
Bitcoin Cash (BCH/USD) has been trending positively, with bullish momentum driving the price toward the critical $540 resistance level. Although this zone presents significant overhead resistance, underlying bullish sentiment remains strong—evident in the market’s ability to hold above the $515 support level for several consecutive days.
Buyers have consistently defended this support, and in today’s trading session, price action has surged once again toward the $540 mark. This renewed push raises the possibility of a breakout above this key resistance. To better evaluate this potential move, a deeper analysis of market indicators is essential.
Bitcoin Cash (BCH/USD) Market Data
- BCH/USD Price Now: $539
- BCH/USD Market Cap: $10 billion
- BCH/USD Circulating Supply: 19.9 million BCH
- BCH/USD Total Supply: 19.9 million
- BCH/USD CoinMarketCap Ranking: #15
Key Levels
- Resistance: $540 $560 and $580
- Support: $510, $500, and $480
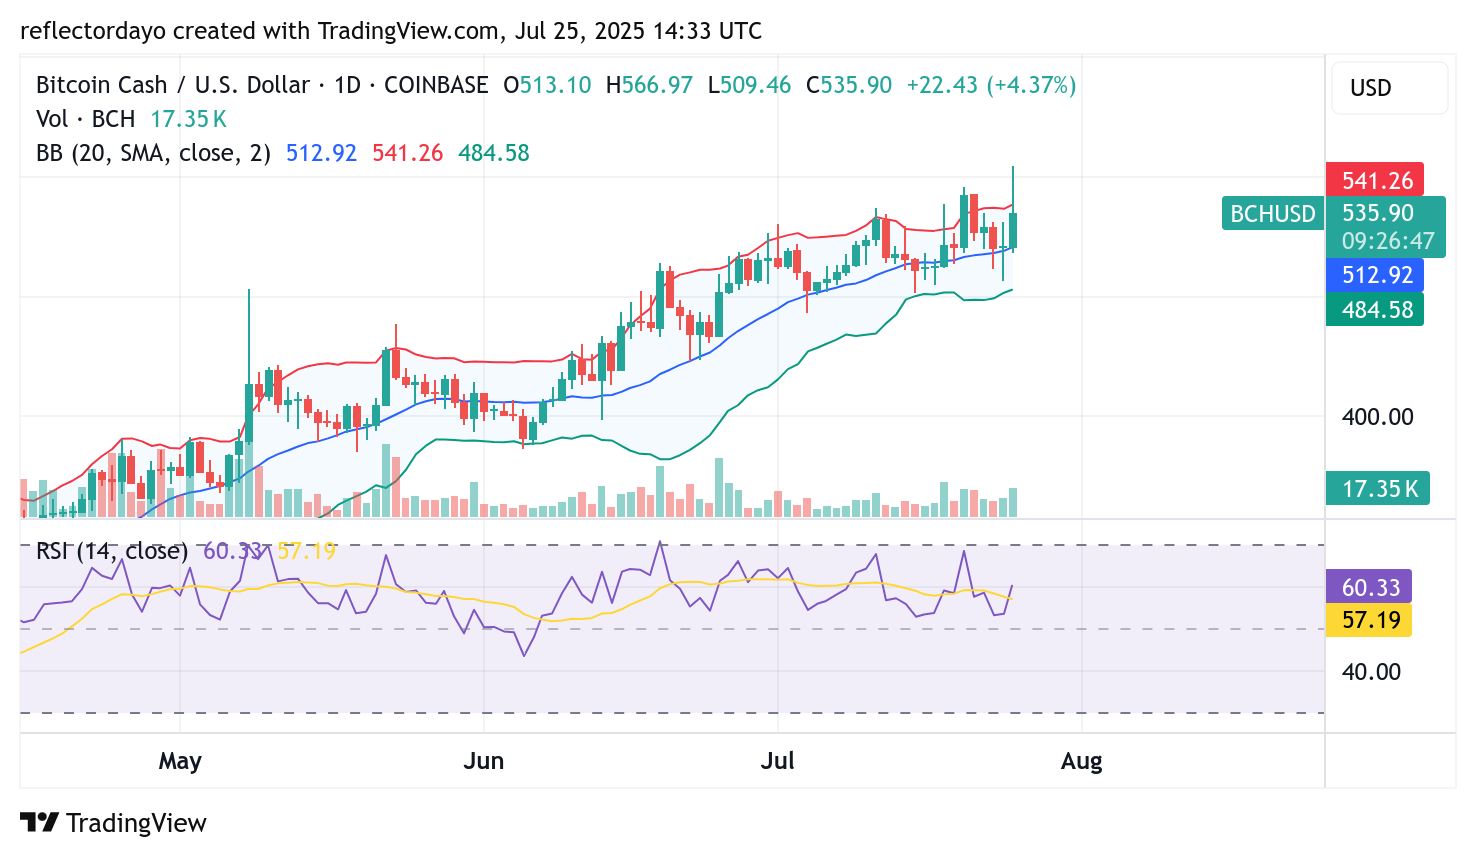
Bitcoin Cash (BCH/USD) Technical Outlook: BCH/USD Holds Firm Near Resistance as Volatility Persists Within Sideways Range
Over the past few days, Bitcoin Cash (BCH/USD) has been consolidating, trading sideways within a defined range between the $515 support and the $540 resistance levels. The Bollinger Bands indicator reflects elevated market volatility, which helps explain the strong rejection at the $540 resistance zone.
Despite this persistent resistance, bulls have demonstrated resilience by maintaining price action near the upper boundary of the range. Their ability to keep the market positioned close to this key level signals underlying bullish strength amid ongoing crypto market turbulence.
However, with the Bollinger Bands showing a wide spread—indicating sustained volatility—traders may begin to adopt a more cautious approach. This could lead to a continued period of consolidation unless a decisive breakout above the $540 level occurs.
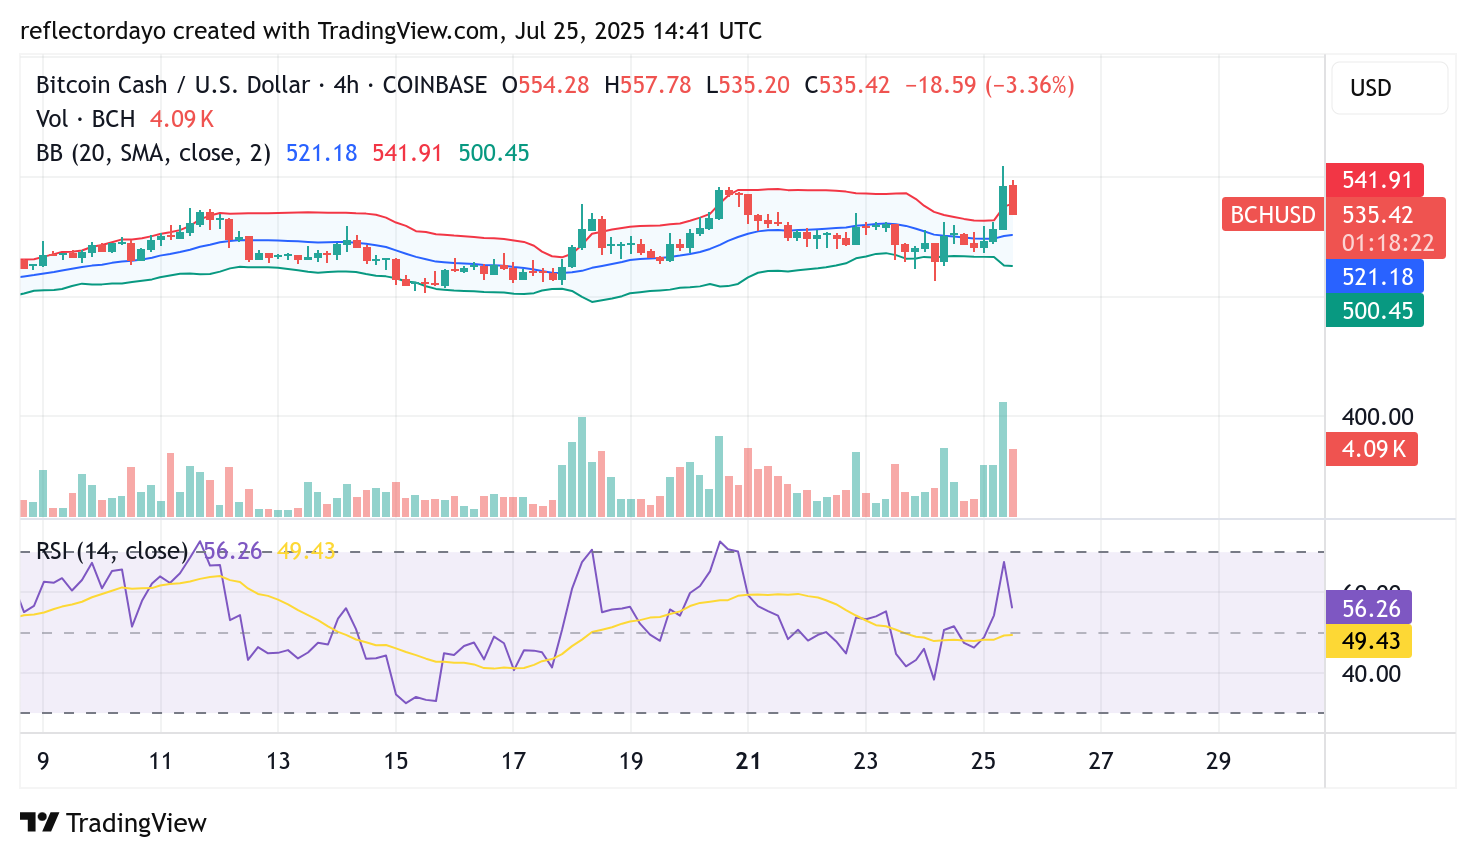
BCH/USD 4-Hour Chart Analysis: Bullish Structure Holds Amid Profit-Taking and Volatility
From the 4-hour chart perspective, Bitcoin Cash (BCH/USD) is currently undergoing a price correction, following a recent peak above the $540 resistance level. This correction appears to be driven by a wave of profit-taking, especially after the market briefly surged to the $560 mark.
The volume histogram shows a substantial level of trading activity, indicating continued market interest. However, some traders are capitalizing on recent gains, leading to the current pullback. Despite this retracement, technical indicators suggest that the market remains in bullish territory, implying that the bulls still maintain an advantage. That said, elevated volatility may keep price action choppy in the near term.