Curve (CRV/USD) Bulls Strive to Sustain Uptrend Momentum
Estimated Reading Time: 3 minutes
Don’t invest unless you’re prepared to lose all the money you invest. This is a high-risk investment and you are unlikely to be protected if something goes wrong. Take 2 minutes to learn more

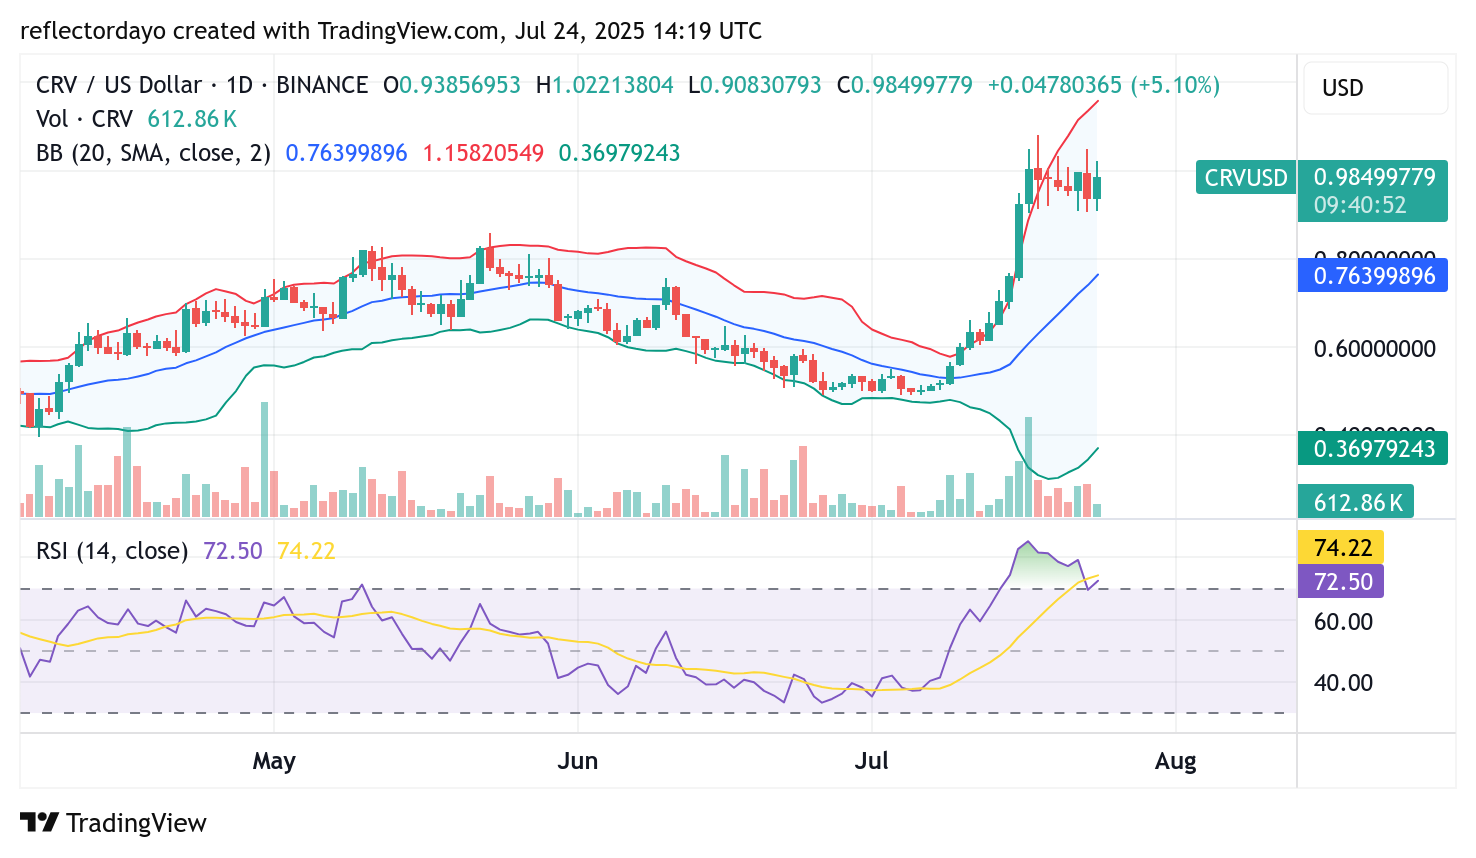
After a notable bullish rally, the Curve (CRV/USD) market has entered a consolidation phase near the key psychological resistance at the $1.00 mark. Despite testing this critical level multiple times, the bulls have managed to maintain a firm grip on market sentiment.
Given the strength of the preceding rally, a pullback might have been expected—potentially to a higher support zone around $0.80. However, buyers stepped in earlier than anticipated, defending the price strongly at approximately $0.91. This resilient support reinforces the underlying bullish bias and suggests that the bulls are not yet ready to cede control.
The ongoing price consolidation above $0.90 indicates that market participants are accumulating positions, potentially setting the stage for another upward push if resistance at $1.00 is eventually breached.
Curve (CRV/USD) Market Data
- CRV/USD Price Now: $0.981
- CRV/USD Market Cap: $1.37 billion
- CRV/USD Circulating Supply: 1.4 billion
- CRV/USD Total Supply: 2.28 billion
- CRV/USD CoinMarketCap Ranking: #67
Key Levels
- Resistance: $1.00, $1.50, and $2.00
- Support: $0.90, $0.80, and $0.70
Curve (CRV/USD) Technical Outlook: Bulls Eye Breakout Despite Overbought Conditions
The Bollinger Bands indicator reflects heightened market volatility yet maintains a bullish undertone. Both the upper and lower bands—alongside the 20-day moving average—are trending upward, aligning with the recent bullish price movement. The wide bandwidth suggests that the Curve market may be vulnerable to a strong correction, particularly as the Relative Strength Index (RSI) signals overbought conditions.
Despite these warning signs, buyers continue to defend the $0.90 support zone, applying steady pressure on the key $1.00 resistance level. This ongoing battle between bullish and bearish forces is creating a phase of indecision around this critical price point.
Supporting this narrative, the volume histogram has shown a noticeable decline, indicating reduced trading activity and the likelihood of price consolidation. However, if bulls can sustain their current stance and maintain buying pressure, there’s a growing probability that bearish momentum could weaken, potentially paving the way for a breakout above $1.00.
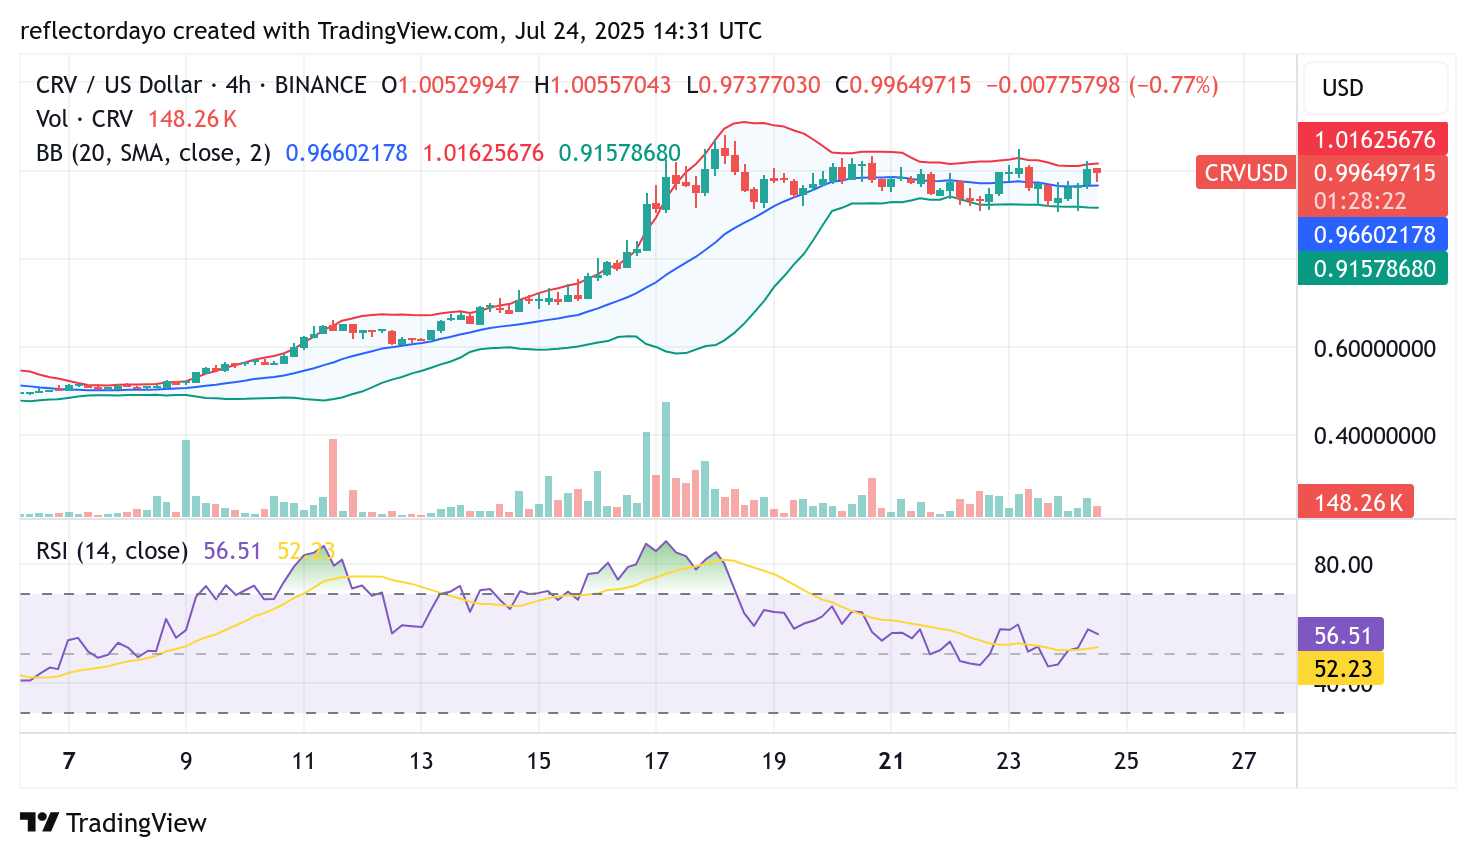
CRV/USD 4-Hour Chart Analysis: Bulls Hold the Line as $1.00 Resistance Limits Upside
A closer look at the 4-hour chart reveals that Curve bears continue to maintain dominance above the $1.00 resistance level. Despite repeated attempts, bulls have struggled to secure a decisive breakout beyond this critical threshold.
However, buyers have successfully established a firm support base at the $0.95 level, which has consistently held against bearish pressure. This tug-of-war between buyers and sellers underscores a consolidation phase, where neither side has yet gained clear control. The inability of bears to push the price below $0.95—and the bulls’ failure to overcome $1.00—highlights a critical period of market indecision.