The Sui Market (SUI/USD) Bullish Momentum Slows as Price Nears $1.20
Estimated Reading Time: 3 minutes
Don’t invest unless you’re prepared to lose all the money you invest. This is a high-risk investment and you are unlikely to be protected if something goes wrong. Take 2 minutes to learn more

The $1.02 price level served as a key resistance point on September 12. However, the Sui market bullish momentum persisted, breaking through the consolidation around this level and pushing the price significantly higher to $1.20. While the price action briefly tested the $1.20 mark, bearish sentiment has emerged, establishing resistance at this level. Despite the minor rejection of upward movement, the market continues to maintain bullish momentum, with the price hovering near the $1.20 resistance zone.
The Sui Market Data
- SUI/USD Price Now: $1.1942
- SUI/USD Market Cap: $ 3.2 billion
- SUI/USD Circulating Supply: 2.7 billion
- SUI/USD Total Supply: 10 billion
- SUI/USD CoinMarketCap Ranking: #25
Key Levels
- Resistance: $1.200, $1.250, and $1.300
- Support: $1.000, $0.900, and $0.800.
The Sui Market Through the Lens of Indicators
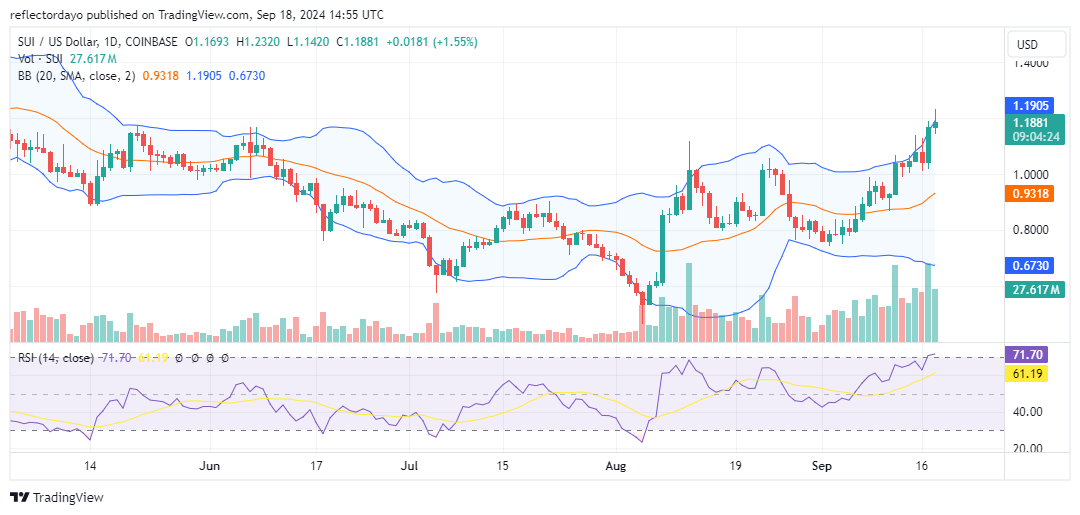
Following the successful break of the $1.02 resistance level, more traders have adopted an optimistic outlook on the Sui market. However, technical indicators suggest caution, as the emergence of bearish bias at this higher price level signals that it may not be an ideal time to invest. This could simply be a pause in the broader bull market, so traders should closely monitor developments around the $1.20 level to determine whether the bullish trend will continue.
From an indicator perspective, a potential market correction could be on the horizon. The Bollinger Bands show a wide bandwidth, with price movement near the upper band of the upward trend. Meanwhile, the Relative Strength Index (RSI) has entered the overbought region, which could spark concern among traders. Despite these crypto signals, the volume trader indicator shows high histogram levels, indicating strong investor interest. This increased trading volume could bolster the bullish sentiment.
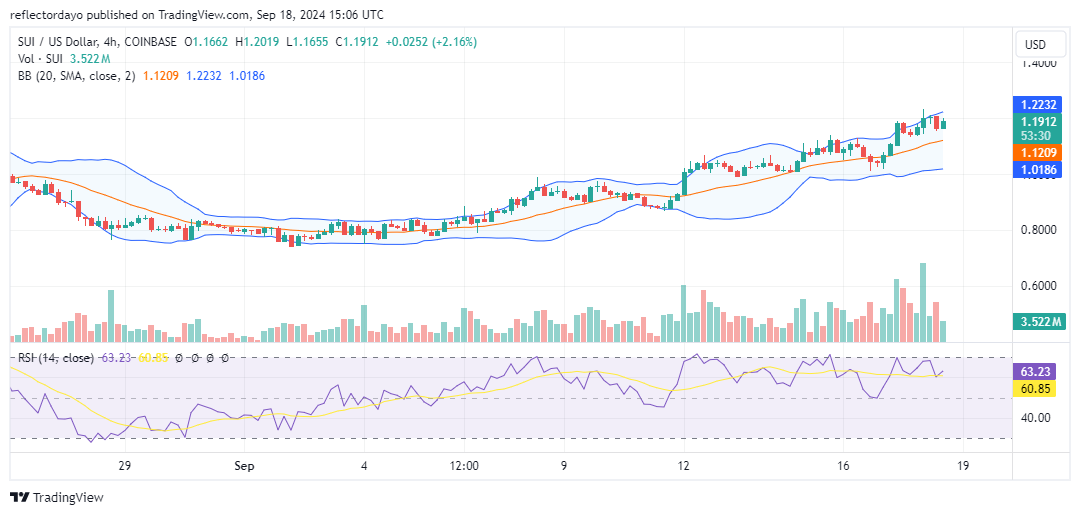
SUI/USD Price Prediction: 4-Hour Chart Analysis
On the 4-hour chart, price action clearly shows an uptrend, with movement consistently above the 20-day moving average. However, as the price reaches the $1.20 level, it repeatedly bounces off, confirming the emergence of a resistance point at this level. If bullish traders can defend a nearby support level, such as $1.169, it could reinforce confidence in the continuation of the upward trend. Holding this support would suggest that the market is poised to maintain its bullish momentum.