API3 Market (API3/USD) Poised to Conclude Its Bearish Cycle: A Shift on the Horizon?
Estimated Reading Time: 3 minutes
Don’t invest unless you’re prepared to lose all the money you invest. This is a high-risk investment and you are unlikely to be protected if something goes wrong. Take 2 minutes to learn more
Since reaching its annual high of nearly $5.00 in February, the API3 market has experienced a prolonged bearish trend. In May, there was a brief respite from the downward pressure, with the price briefly surging and forming higher highs. However, this upward momentum was short-lived, as the market subsequently consolidated at the $2.373 level for over three weeks. Despite a subsequent rally that pushed the price above $3.60, this new high failed to surpass the previous February peak, indicating that the overall bearish sentiment persists.
The API3 Market Data
- API3/USD Price Now: $1.532
- API3/USD Market Cap: $130 million
- API3/USD Circulating Supply: 86 million
- API3/USD Total Supply: 141 million
- API3/USD CoinMarketCap Ranking: #278
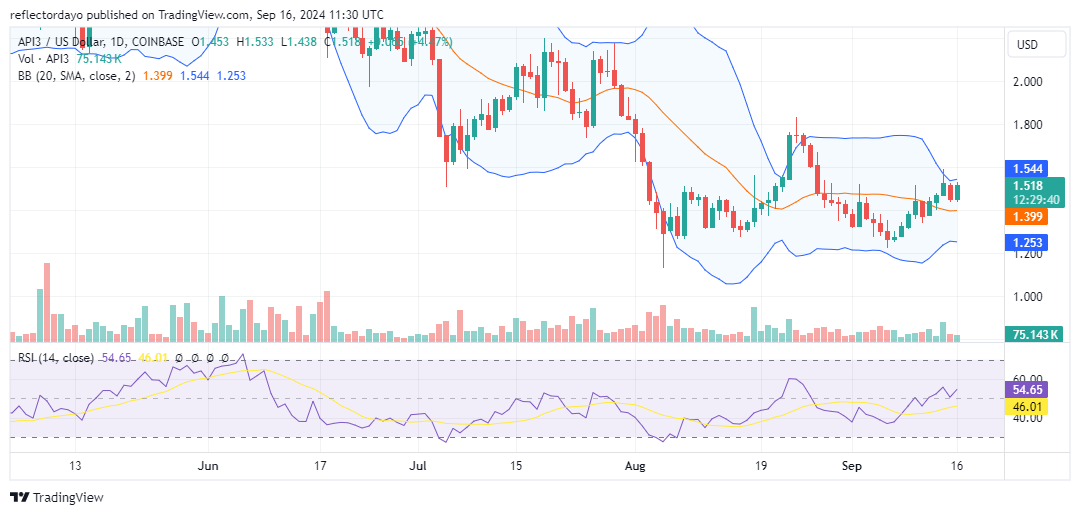
Key Levels
- Resistance: $1.60, $1.80, and $2.00
- Support: $1.40, $1.35, and $1.30.
The API3 Market Through the Lens of Indicators
The API3 market’s continued bearish trend was evident in May when it formed a lower high, indicating that sellers remained dominant. This downward pressure has significantly pushed the price lower, and it is currently trading around the $1.50 level. However, a potential shift in the market sentiment may be emerging. The prolonged consolidation around the $1.45 level for over five weeks suggests that a period of indecision is ending. This consolidation could be a precursor to a significant price move, potentially upward. Historically, similar consolidation phases have sometimes preceded minor bullish recoveries, suggesting that a similar pattern might unfold in the case of this crypto signal.
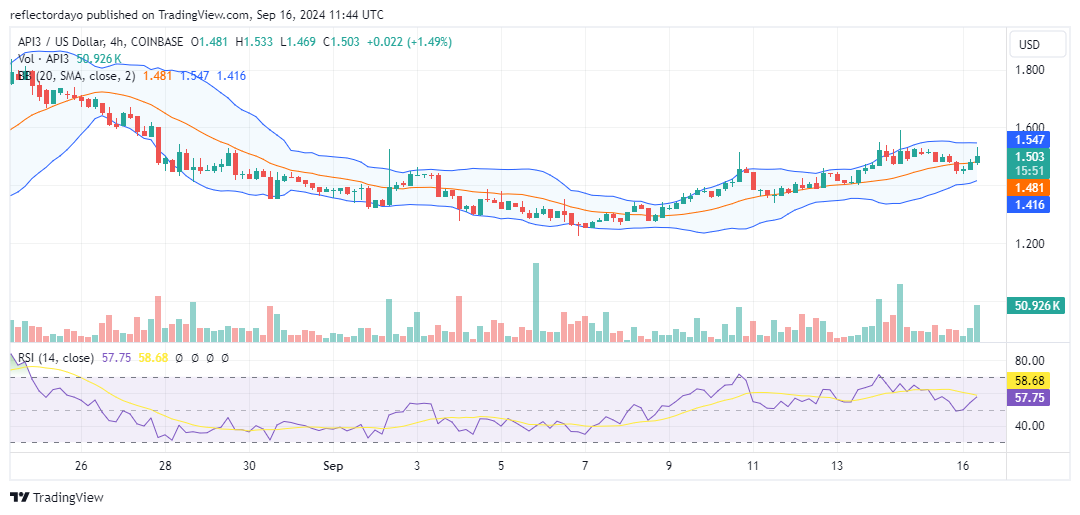
API3/USD Price Prediction: 4-Hour Chart Analysis
The API3 market has demonstrated a bullish recovery since finding strong support at the $1.24 level. However, despite this upward trend, there is evidence of bearish sentiment emerging around the $1.60 price level. Recent attempts to push the market higher have been rejected at this level, suggesting a potential resistance zone. Furthermore, the current candlestick pattern, while bullish, features upper shadows, indicating that some traders may be taking profits as the market approaches $1.60. This early resistance may limit the extent of the bullish rally.