Polkadot (DOT) Slumps After Formation Of A Bearish Double Top, May Decline To $24 Low
Estimated Reading Time: 2 minutes
Don’t invest unless you’re prepared to lose all the money you invest. This is a high-risk investment and you are unlikely to be protected if something goes wrong. Take 2 minutes to learn more
Polkadot (DOT) Long-Term Analysis: Bearish
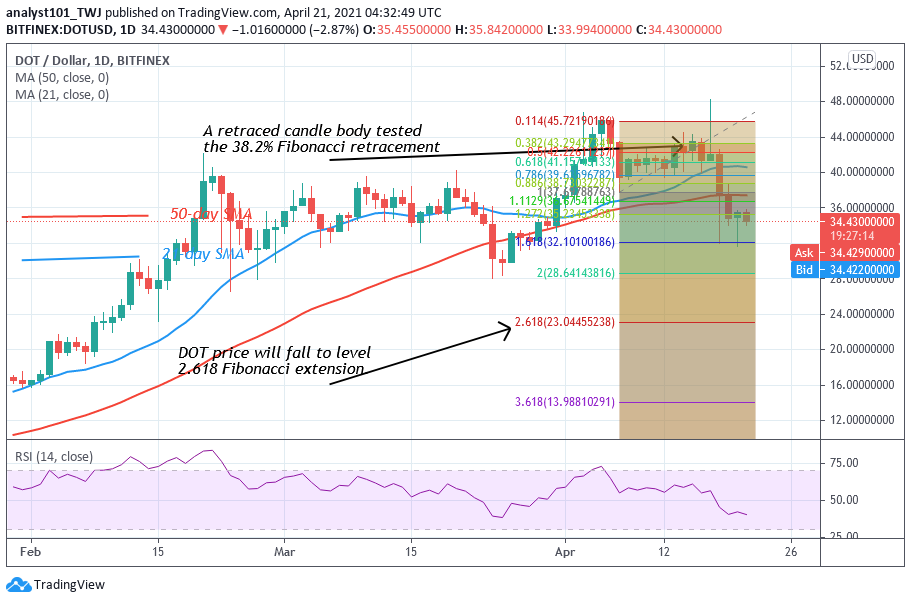
Polkadot (DOT) is making a downward move after buyers fail in their attempt to breach the $48 resistance level. On April 5, buyers pushed DOT price to the high $45.86 and were resisted. The market fell to the low of $37.74 as price corrected upward. On April 17, buyers again pushed the DOT price to $48.30 and were repelled. The coin has fallen to $34 and further downside is likely. On April 7 downtrend; a retraced candlestick body tested the 38.2% Fibonacci retracement level. The retracement implies that DOT will fall to level 2.618 Fibonacci extension or $23.04.
Polkadot (DOT) Indicator Analysis
The crypto is at level 40 of the Relative Strength Index period 14. It indicates that the market is in the downtrend zone and the coin is capable of falling. . The 21-day and 50-day SMAs are sloping upward indicating the previous uptrend.
Technical indicators:
Major Resistance Levels – $48, $52, $56
Major Support Levels – $32, $28, $24
What Is the Next Direction for Polkadot (DOT)?
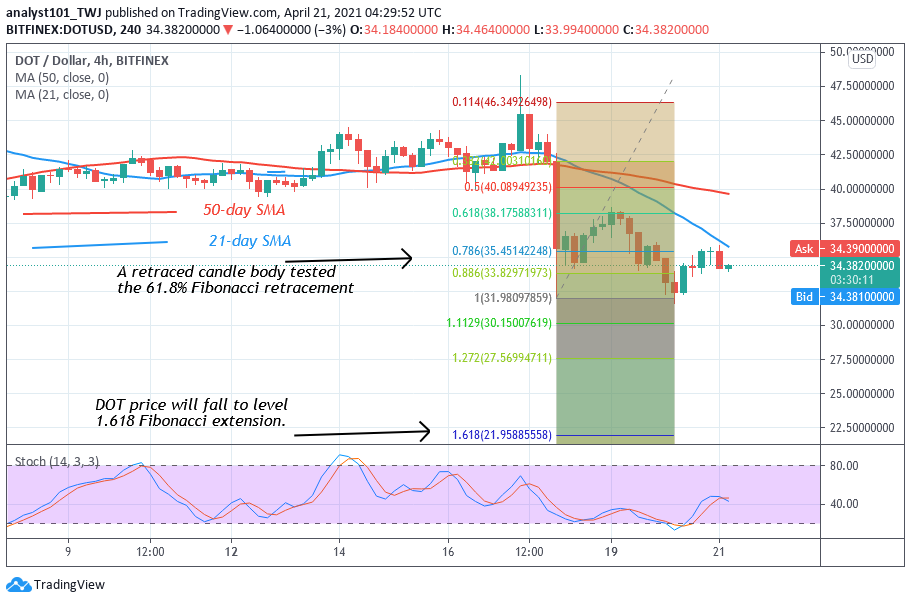
On the 4 hour chart, Polkadot is in a sideways move below the $47.50 since April 3. DOT price has been fluctuating between $40 and $47.50 as buyers attempt to break the resistance at $47.50. On April 18 downtrend, a retraced candle body tested the 61.8% Fibonacci retracement level. This retracement implies that DOT will fall to level 1.618 Fibonacci extensions or the low of $21. 95.
Note: cryptosignals.org is not a financial advisor. Do your research before investing your funds in any financial asset or presented product or event. We are not responsible for your investing results