Aerodrome Finance (AERO/USD): Choppy Price Action Around the $1.20 Mark
Estimated Reading Time: 3 minutes
Don’t invest unless you’re prepared to lose all the money you invest. This is a high-risk investment and you are unlikely to be protected if something goes wrong. Take 2 minutes to learn more

In the Aerodrome Finance market, strong price activity has emerged around the $1.20 level as bulls attempt to establish control. The bullish recovery began near the $0.80 price region after an extended period of sideways consolidation that started around October 11. However, as the price climbed toward the $1.20 level, the market began to show signs of bearish pressure, resulting in notable resistance and choppy movement around this zone.
Aerodrome Finance (AERO/USD) Market Data
- AERO/USD Price Now: $1.21
- AERO/USD Market Capitalization: 1.1 billion
- AERO/USD Circulating Supply: 902.2 million AERO
- AERO/USD Total Supply: 1.78 billion AERO
- AERO/USD CoinMarketCap Ranking: #67
Key Levels to Watch
- Resistance: $1.30, $1.40, $1.50
- Support: $1.10, $1.00, $0.90
Aerodrome Finance (AERO/USD) Daily Chart
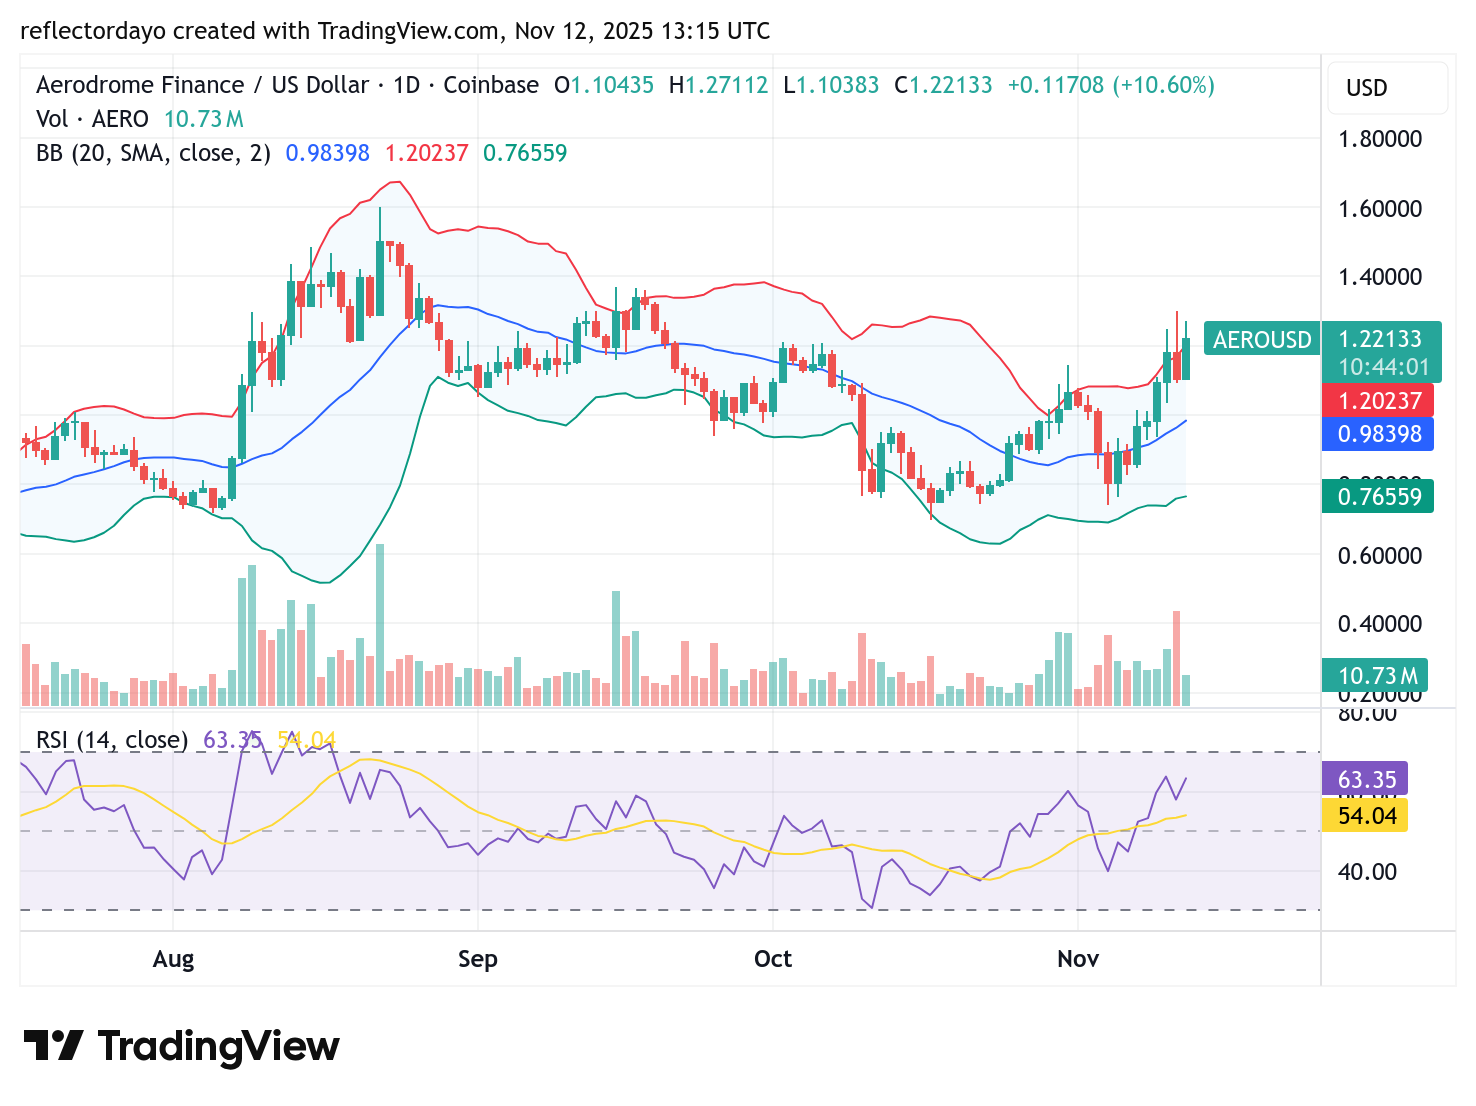
The Aerodrome Finance bulls have shown strong resilience around the $0.80 price level, maintaining their position despite persistent bearish pressure since October 11. This support held firm until November 5, when the market began a notable upward surge. The strength of this bullish recovery is clearly reflected in the Bollinger Bands, as the upper band—representing the upper standard deviation—is expanding in response to the rising price momentum.
However, bearish presence has started to emerge around the $1.20 level, creating resistance that has temporarily slowed the bullish advance. Although buyers remain ambitious in pushing the market higher toward the $1.40 mark, this resistance has proven challenging.
The Relative Strength Index (RSI), currently around 63, indicates that the market is not yet overbought, suggesting there may still be room for the bulls to extend the rally if momentum strengthens further.
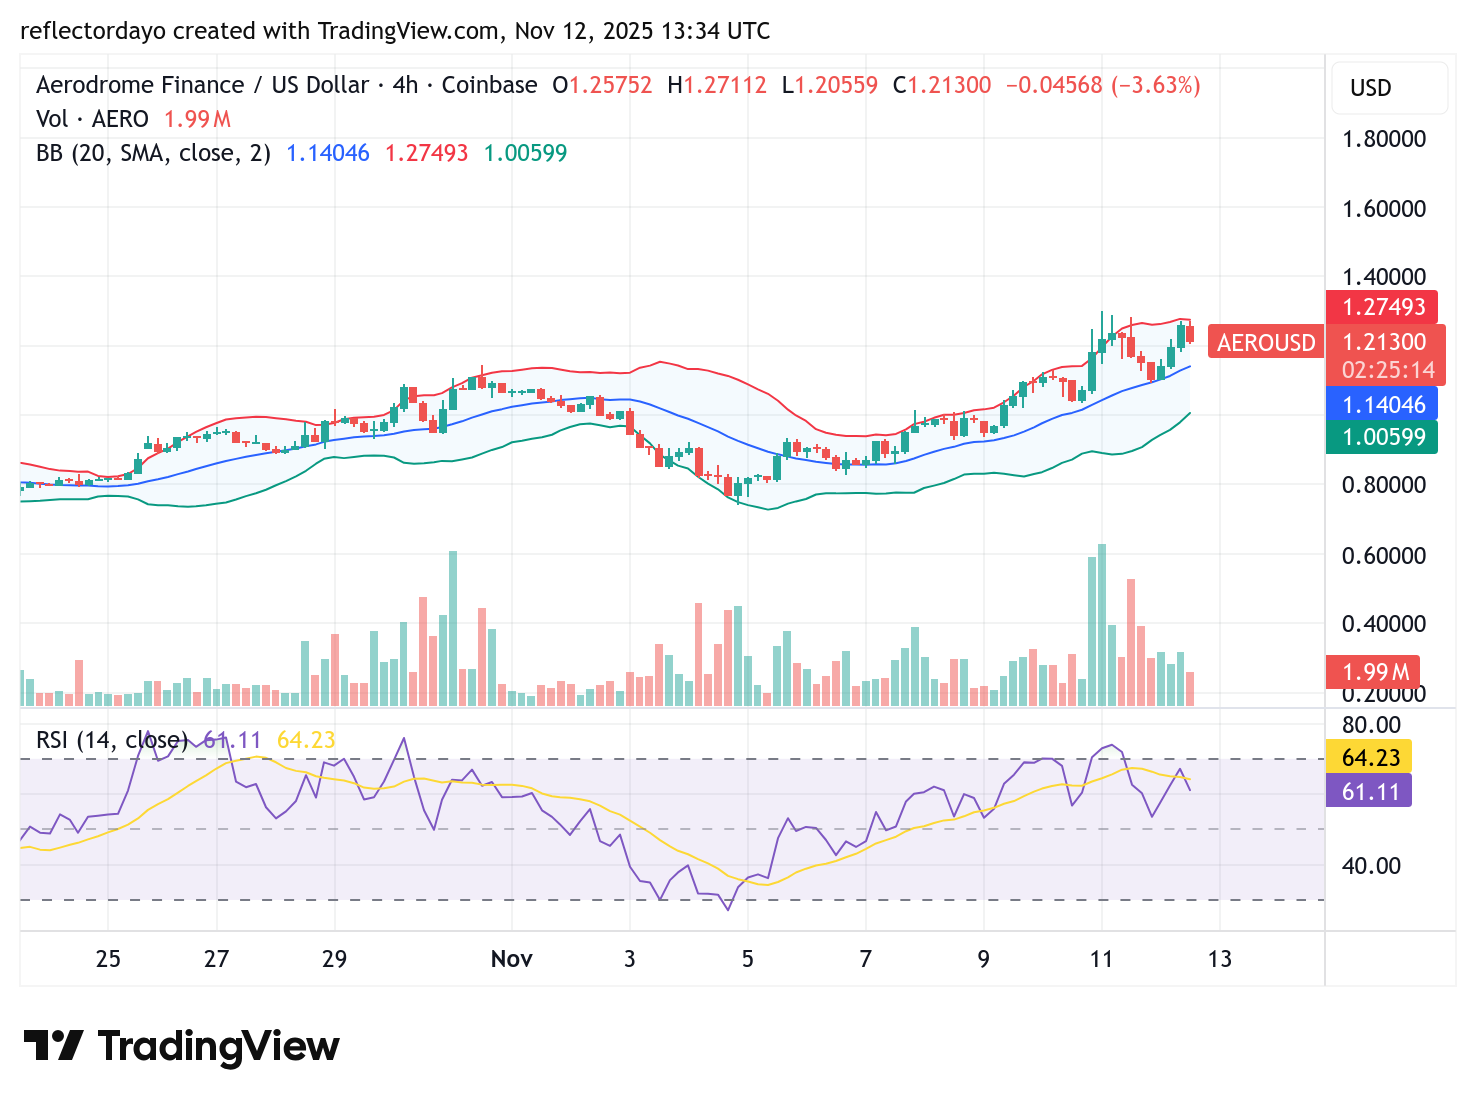
AERO/USD 4-Hour Chart Outlook
From the 4-hour chart perspective, the Relative Strength Index (RSI) does not yet indicate an overbought condition, suggesting that the bulls may still have room to push prices higher. The $1.20 level appears to be a critical area where buyers could hold their ground. If this support is maintained, the market may enter a consolidation phase around this price region.
Supporting this outlook, the trading volume indicator shows a gradual decline, signaling reduced market activity. This decrease in volume often precedes a consolidation phase, reinforcing the likelihood that the AERO/USD market may stabilize around the $1.20 level before the next decisive move.