XRP (XRP/USDT) Struggles to Maintain Momentum as Price Heads South
Estimated Reading Time: 3 minutes
Don’t invest unless you’re prepared to lose all the money you invest. This is a high-risk investment and you are unlikely to be protected if something goes wrong. Take 2 minutes to learn more

XRP Long-term Analysis: Bullish
Prior before this moment, the market for XRP against the Tether has enjoyed a rally that made the pair to peak around $2.7600, forming series of bullish candlestick along the way. However, for some reasons which can be attributed to profit-taking the pair has face a sharp pullback with attempt at recovery.
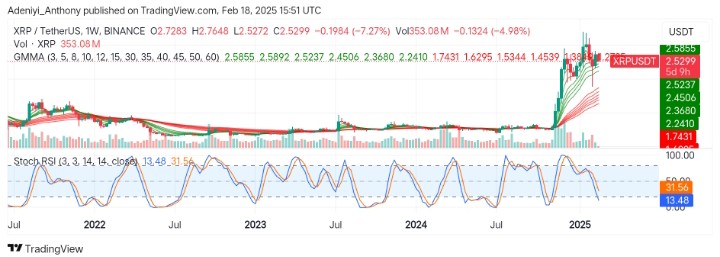
Recently, the price movement indicates a movement to the south, though the overall market sentiment is still bullish according to the Guppy Multiple Moving Averages (GMMAs), the Stochastic RSI indicates a weakening momentum as the oscillator extends into the oversold region.
Currently, XRP trades at $2.5299, recording 4.98% decline in price, with over 350 million traded volumes for the week.
Technical Indicators
Major Resistance Levels: $2.5855, $2.7648, and $ 2.8000
Major Support Levels: $2.4506, $2.3608, and $1.7431
XRP Technical Analysis
On the weekly timeframe, XRP against the Tether is currently going through a correction phase after hitting a major height. The GMMAs signals further upside activities as the short-period EMAs positioned nicely above the long-period, suggesting more room for improvement despite recent dip in price.
On the other hand, the Stochastic RSI indicates a weakened momentum, indicating a potential downward continuation. However, the lines seem to be in the oversold region. This could indicate a short-term continuation before a bounce.
To this end, bullish traders will need to maintain momentum above $2.4506 as volume increases; otherwise, a break below the immediate support would indicate further downtrend.
XRP/USDT Analysis: Expectations
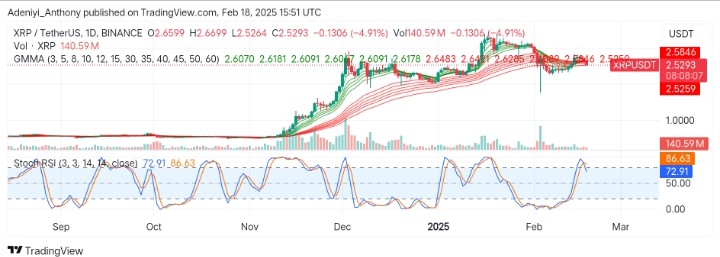
On the daily timeframe, XRP/USDT consolidates with a flattened short-period EMAs which suggests waning momentum. However, the Stochastic RSI indicates an overbought condition, meaning that the momentum is still strong, but could be nearing exhaustion which could lead to a potential pullback in the near term.
To this end, XRP/USDT might experience a short-term pullback before another upside movement. Therefore, if support holds at $2.5200, a rebound towards the $2.600 level is likely; otherwise, a break at this level would signal a test of the $2.4800 support level.
You can purchase crypto coins here. Buy LBlock