Loopring (LRC/USD) Struggles to Reverse Market Trend at $0.07
Estimated Reading Time: 3 minutes
Don’t invest unless you’re prepared to lose all the money you invest. This is a high-risk investment and you are unlikely to be protected if something goes wrong. Take 2 minutes to learn more

For some time now, the Loopring (LRC/USD) market has been locked in a persistent bearish trend. Since the beginning of the year, prices have steadily declined from around the $0.25 level, reflecting continuous downside volatility and sustained selling pressure.
Recently, however, as the market approached the $0.07 zone, bearish momentum appears to have slowed, suggesting a potential point of stabilization. In today’s trading session, Loopring is showing signs of recovery, with a notable rebound and upward price movement indicating that buyers may be attempting to regain control.
Loopring (LRC/USD) Market Data
- LRC/USD Price Now: $0.0725
- LRC/USD Market Capitalization: 98 million
- LRC/USD Circulating Supply: 1.36 billion LRC
- LRC/USD Total Supply: 1.37 billion LRC
- LRC/USD CoinMarketCap Ranking: #321
Key Levels to Watch
- Resistance: $0.08, $0.085, $0.09
- Support: $0.06, $0.055, $0.05
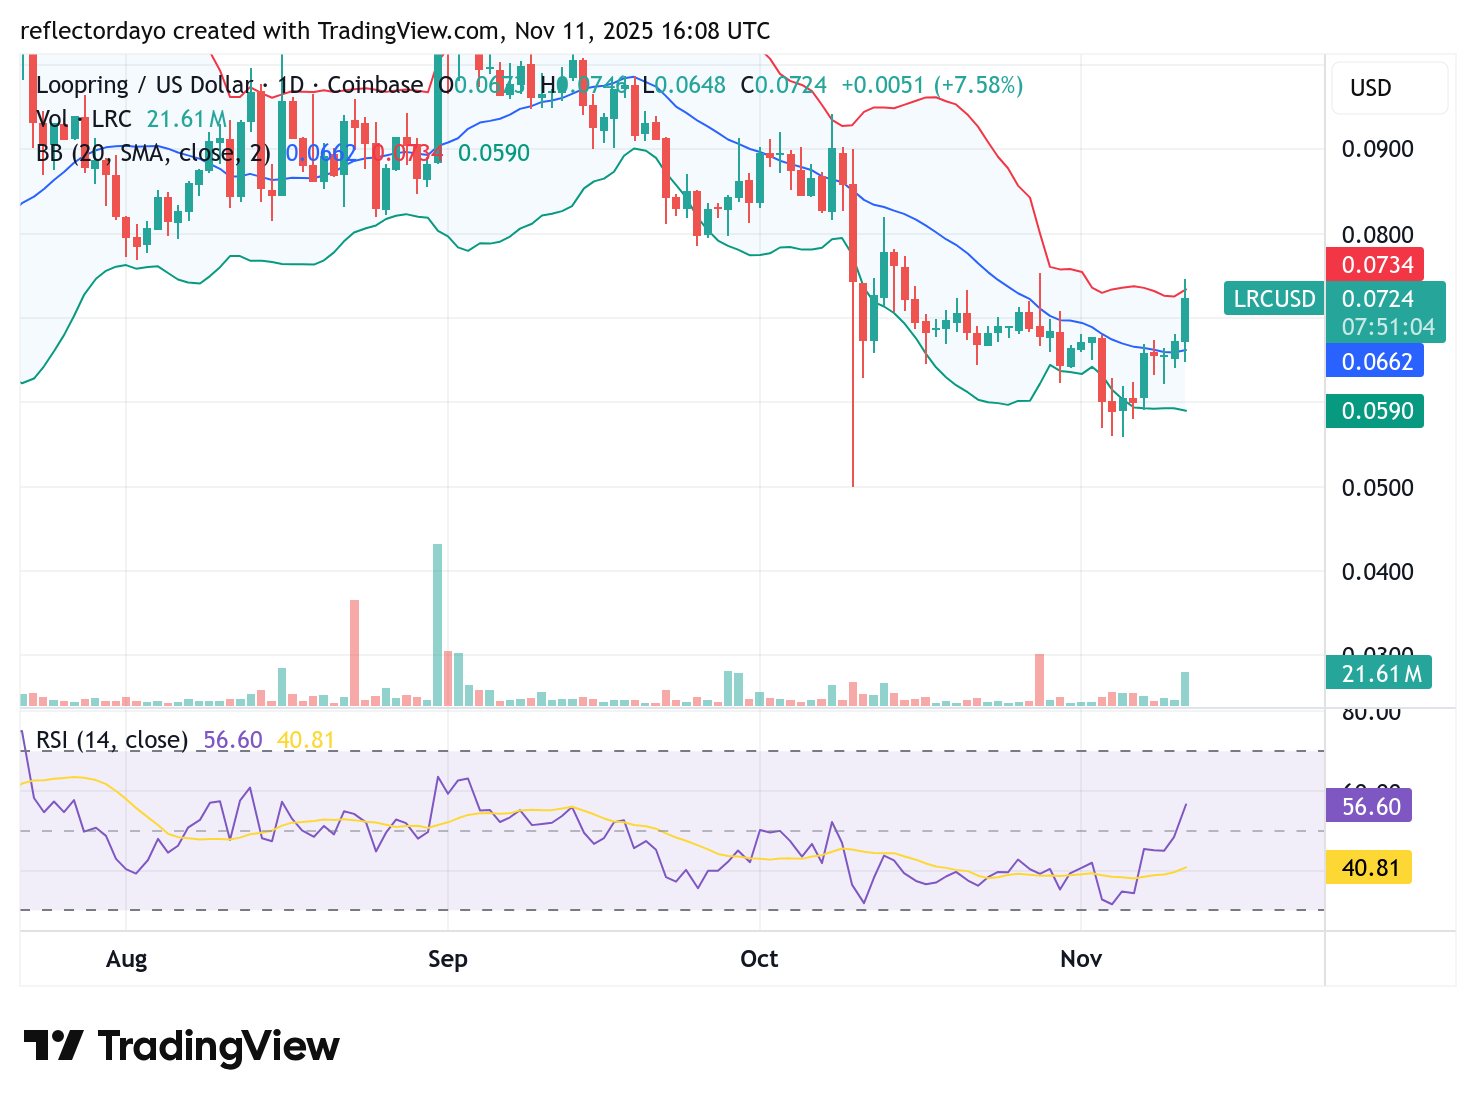
Loopring (LRC/USD) Daily Chart
While bullish sentiment has attempted to sustain the market around the $0.07 level for some time, Loopring briefly dipped below this mark, finding a pivotal rebound near the $0.06 support zone. The crypto market is currently striving to reclaim dominance above $0.07, signaling early attempts at recovery.
From a technical perspective, today’s price movement has had limited impact on the Bollinger Bands, suggesting that volatility remains relatively contained. However, the trading volume histogram indicates strong market activity, reflecting growing interest among participants.
For a more convincing bullish recovery, the Loopring price will need to hold above $0.07 and break decisively past the $0.08 resistance level. Until such confirmation occurs, the upward move may remain preliminary and unproven.
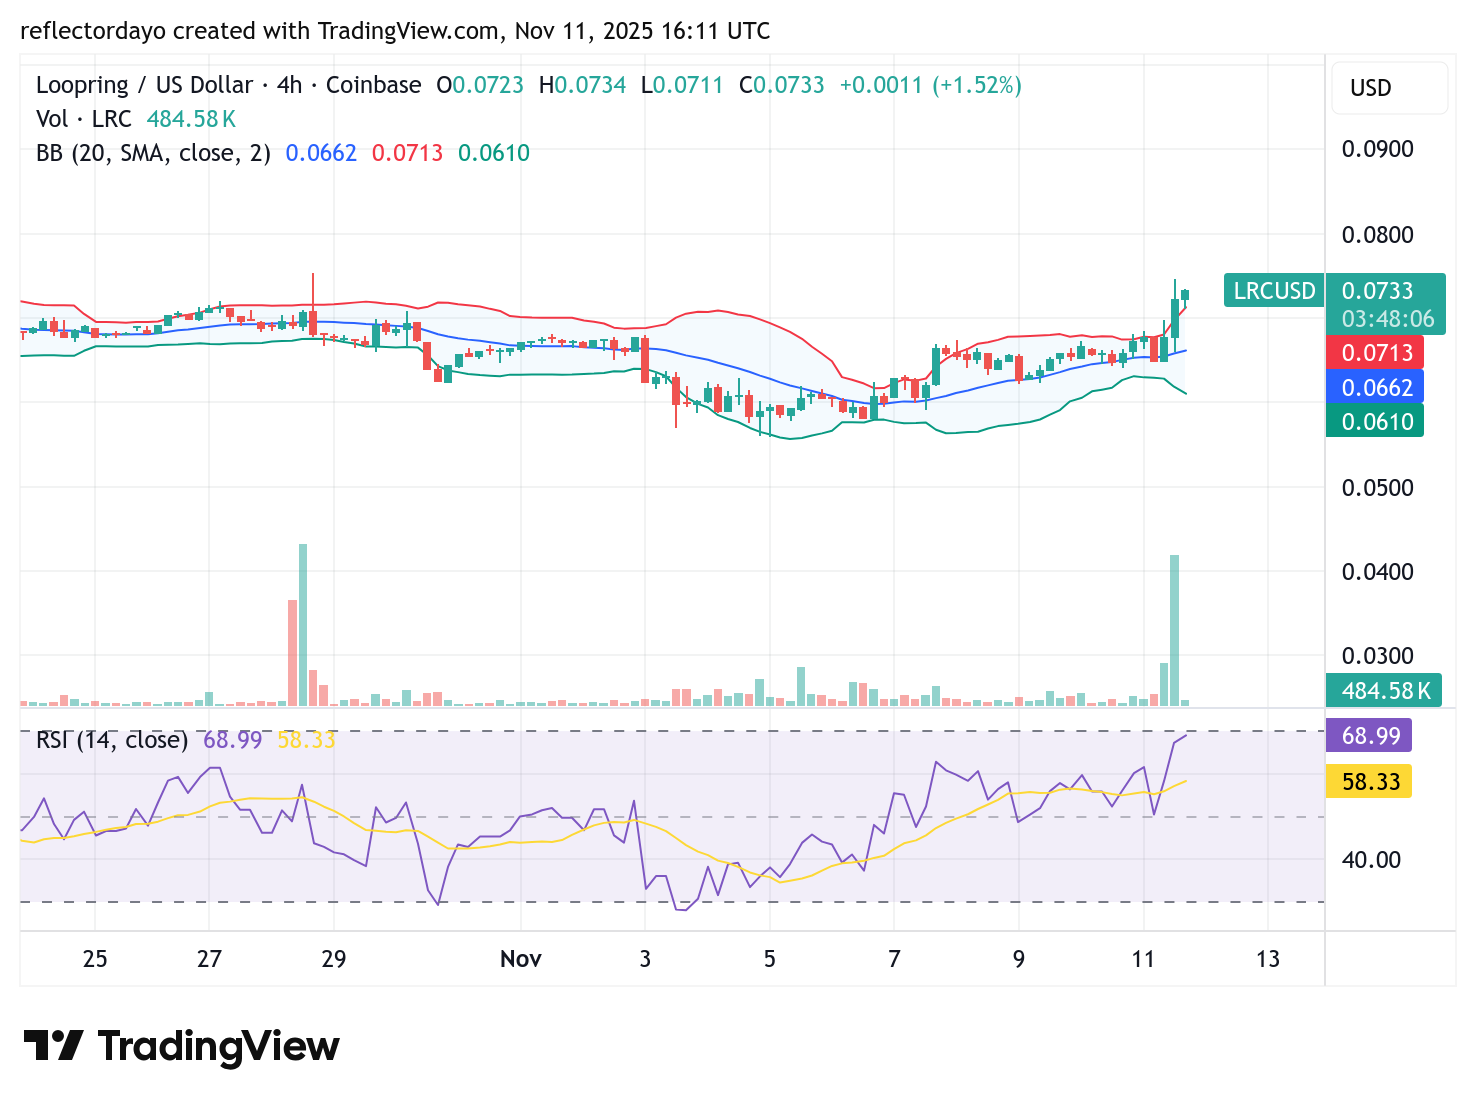
LRC/USD 4-Hour Chart Outlook
Resistance appears to be forming just above the $0.07 level, particularly within the $0.0726 to $0.0750 price zone—an area that highlights the ongoing tug-of-war between demand and supply.
An examination of the trading volume indicator reveals that this current stabilization follows a significant surge in market activity, indicating heightened participation among traders. Despite the bulls recently reclaiming $0.07 as a support level, the nearby resistance suggests persistent bearish pressure.
If buying momentum fails to strengthen beyond this zone, the market may face another downward retracement, as sellers continue to exert influence just above the reclaimed support.