Wall Street Memes (WSM) Trade Swings About, Settling for Hikes
Estimated Reading Time: 4 minutes
Don’t invest unless you’re prepared to lose all the money you invest. This is a high-risk investment and you are unlikely to be protected if something goes wrong. Take 2 minutes to learn more
Wall Street Memes Price Prediction – May 13
Reaffirmative pushing proceeds have continually surfaced between buyers and sellers in the market activities that pit the Wall Street Memes coin as the base against the trading market worth of the American dollar, as the situation of business operation shows that the crypto’s trade swings about, settling for hikes.
Despite the choppy action, the market’s refusal to break down decisively below this level suggests a maturing bullish foundation. While upside acceleration may not be immediate, the persistence in holding this critical range hints that patient bulls could be rewarded as the broader trend quietly gears up for continuation. In this environment, caution is warranted for those betting on further downside, as momentum appears to be stabilizing—and potentially reversing—right under their feet.
WSM/USD Market
Key Levels
Resistance levels: $0.001, $0.0015, $0.002
Support levels: $0.0005, $0.0004, $0.0003
WSM/USD – 4-hour Chart
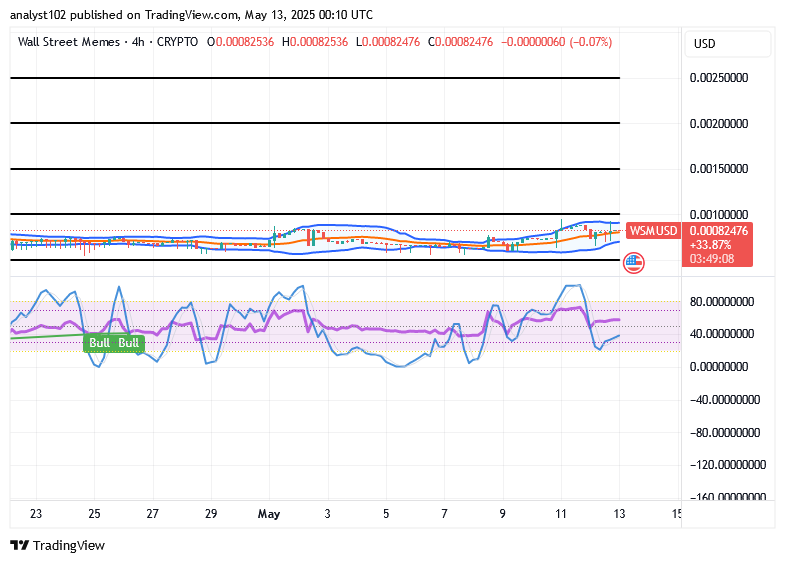
The WSM/USD medium-term chart showcases that the crypto-economic trade swings about, settling for hikes.
The Bollinger Bands continue to flatten, indicating a market in horizontal consolidation, with a subtle upward lean developing just beneath the pivotal $0.001 level. While momentum hasn’t yet shifted decisively, this tentative positioning suggests that the groundwork for a bullish breakout may be forming, albeit quietly.
Has the WSM/USD market bulls’ effort been completely absent, given that the oscillators are consolidating in the oversold region presently?
At this stage, the WSM/USD pair has yet to present strong bullish catalysts across broader technical metrics. However, the stochastic oscillators tell a different story—maintaining a bullish bias even while dipping within the oversold zone. This hidden strength implies that bullish pressure is not absent, only dormant, as the price swings about, settling for hikes.
Sellers should proceed with caution, as the market’s ability to remain buoyant at this critical juncture may ultimately pave the way for a delayed but forceful upside move. For bulls, patience remains key; the current technical posture suggests that while momentum is muted, the potential energy beneath the surface is slowly coiling.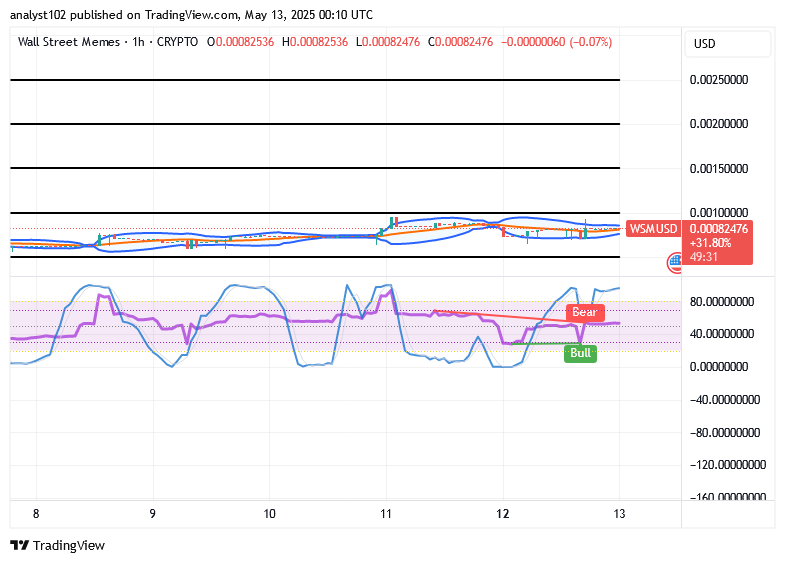
WSM/USD 1-hour chart
The WSM/USD 1-hour chart showcases that the crypto-economic market swings about, settling for hikes in its positioning configuration settings.
The WSM/USD trade remains range-bound between $0.001 and $0.0005, as Bollinger Bands stretch horizontally, indicating ongoing consolidation. The stochastic oscillators show a mild bearish crossover but hover near a potential bullish reentry, suggesting limited downside pressure. Price action lacks momentum, reinforcing a neutral short-term bias. However, sustained support and indicator positioning point toward accumulating bullish potential. A confirmed breakout above $0.001 would likely validate a longer-term upward shift.
Over the past 24 hours, the $WSM token and its community have faced a coordinated and malicious attack, with hackers specifically targeting our Discord platform.
Over the last 24 hours, The $WSM token and community has undergone a coordinated attack. The hackers specifically targeted our Discord community.
— Wall Street Memes (@wallstmemes) October 12, 2023
We reiterate that no one from the Wall St Memes team will ever direct message you first, or ask for any personal information – even… pic.twitter.com/VwySpXC7cz