Berachain (BERA/USD) Gradually Builds Upward Momentum
Estimated Reading Time: 3 minutes
Don’t invest unless you’re prepared to lose all the money you invest. This is a high-risk investment and you are unlikely to be protected if something goes wrong. Take 2 minutes to learn more
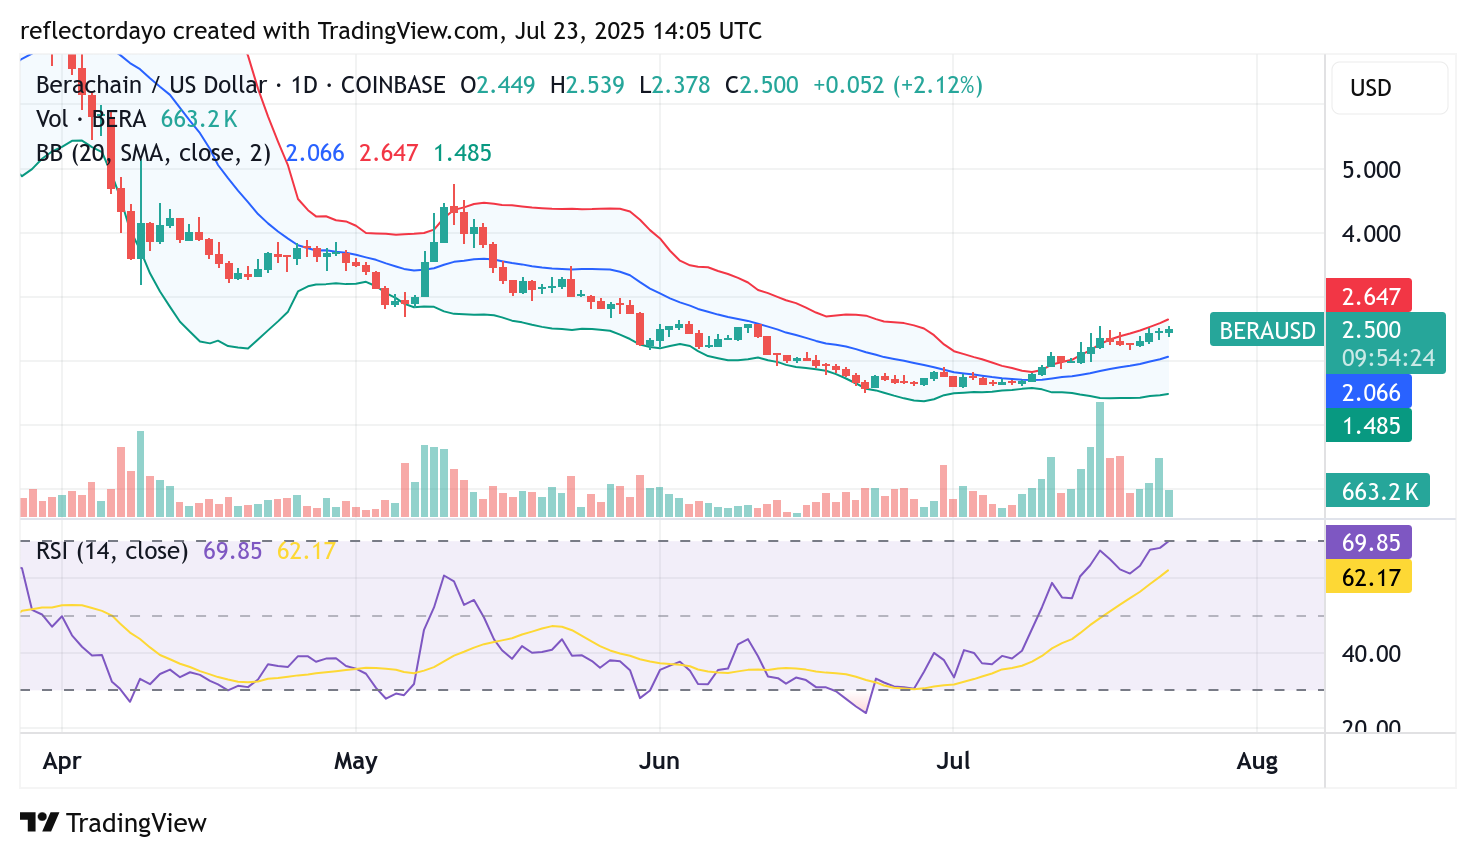
Berachain experienced a slow and steady decline after peaking at approximately $4.80 on May 11. Although a bearish trend was triggered, lingering bullish sentiment helped to moderate the pace of the downtrend. The decline continued until June 22, when emerging bullish interest managed to halt the downward movement near the $1.50 support level.
Following this, the market entered a consolidation phase around that key zone. It wasn’t until July 9 that a clearer bullish recovery began to take shape, signaling a potential shift in market sentiment and a gradual return to upward momentum.
Berachain (BERA/USD) Market Data
- BERA/USD Price Now: $2.504
- BERA/USD Market Cap: $302 million
- BERA/USD Circulating Supply: 120.9 million BERA
- BERA/USD Total Supply: 503.5 million BERA
- BERA/USD CoinMarketCap Ranking: #169
Key Levels
- Resistance: $3.00, $3.50, and $4.00
- Support: $2.00, $1.50, and $1.00
Berachain (BERA/USD) Technical Outlook: Bulls Face Resistance at $2.50
As the Berachain market began its upward move, a noticeable surge in trading volume accompanied the shift. However, despite this increase in trading activity, the price movement has remained relatively modest, indicating a slow and subtle bullish recovery from recent lows.
This recovery now encounters significant resistance around the $2.50 price level, which has temporarily paused further upside momentum. The resulting standoff between bulls and bears is reflected in a declining volume histogram, suggesting waning momentum.
The current setup points to a consolidation phase forming around the $2.50 level, as the crypto signal awaits a decisive breakout or breakdown from this key area.
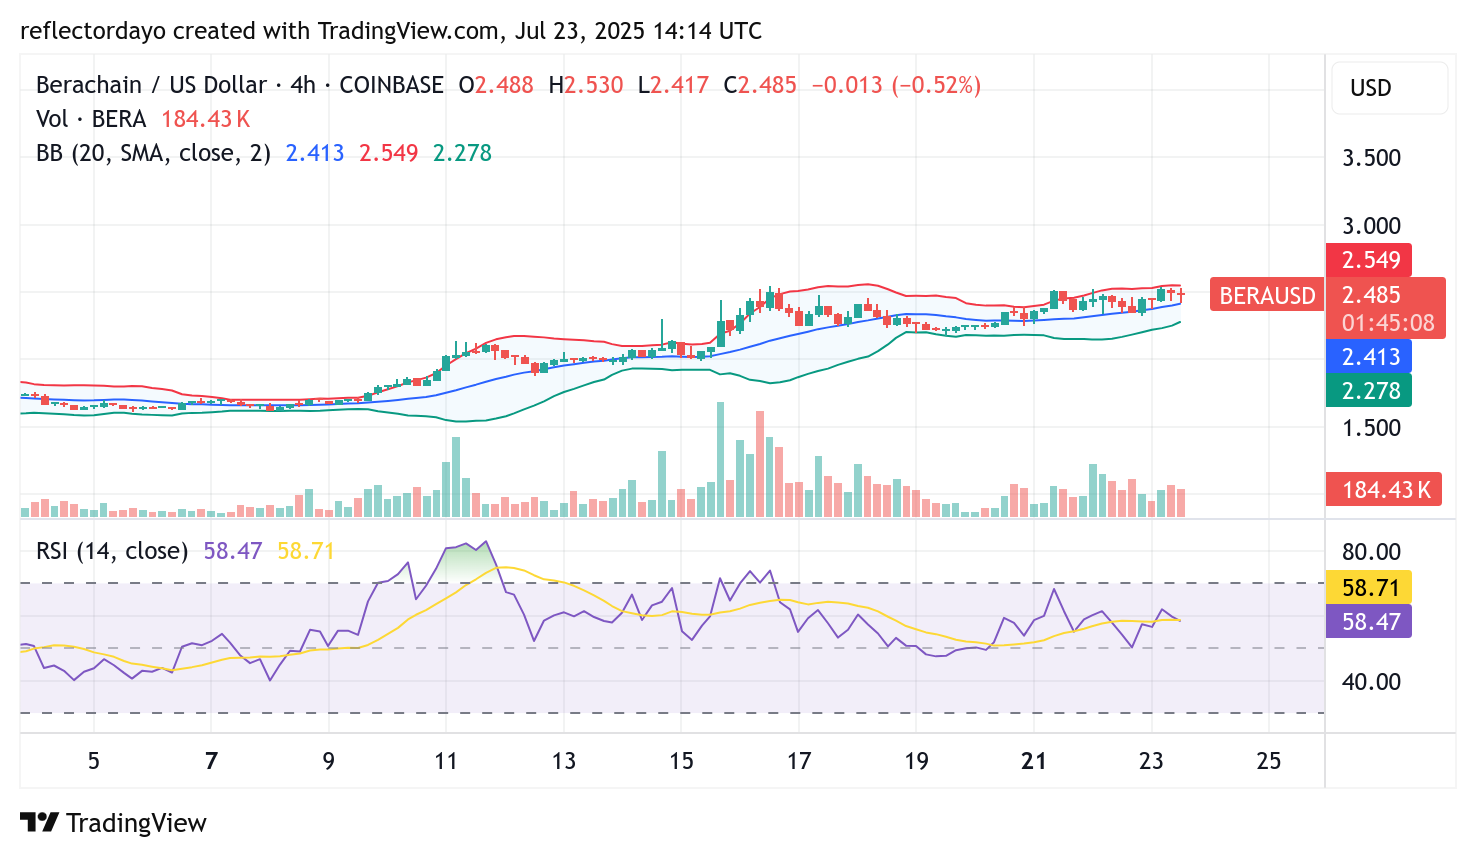
BERA/USD 4-Hour Chart Analysis: Bulls Hold Ground as Resistance at $2.50 Caps Advance
While the market continues to consolidate around the key $2.50 price level, the Relative Strength Index (RSI) suggests that bullish momentum remains slightly dominant, currently measuring at 58. This upward tilt in momentum may indicate growing buying pressure beneath the surface.
If this trend persists, it could be a signal that the next major move in the market is likely to be a bullish breakout above the $2.50 resistance zone.