Solana (SOL/USD) Market Shows Bottom Shadows, Creating a Base
Estimated Reading Time: 3 minutes
Don’t invest unless you’re prepared to lose all the money you invest. This is a high-risk investment and you are unlikely to be protected if something goes wrong. Take 2 minutes to learn more
Solana Price Prediction – January 19
A chain of price relaxations has been ongoing to the extent that the SOL/USD market shows bottom shadows, creating a base around the line of $90.
The elegant sideways pattern of the current trade situation indicates that modest price reductions are occurring. Future bargaining lines may see more valuation declines in a gradual manner due to the tendency to extend the current trade formation. Our advice for investors is to closely monitor price reductions while they tend to revisit points between $90 and $80 when there appears to be a chance for a rebound.
SOL/USD Market
Key Levels:.
Resistance levels: $110, $120, $130
Support levels: $80, $75, $70
SOL/USD – Daily Chart
The SOL/USD daily chart showcases the crypto-economic market and shows bottom shadows, creating a base around the lower Bollinger Band.
The lower Bollinger Band trend line has been strategically placed around the line of $90, leaving the upper side to trend around the point of $110.The stochastic oscillators have been moved to positions around points 60 and 40. And they are portending an indecisive trade sign as of the time of this piece.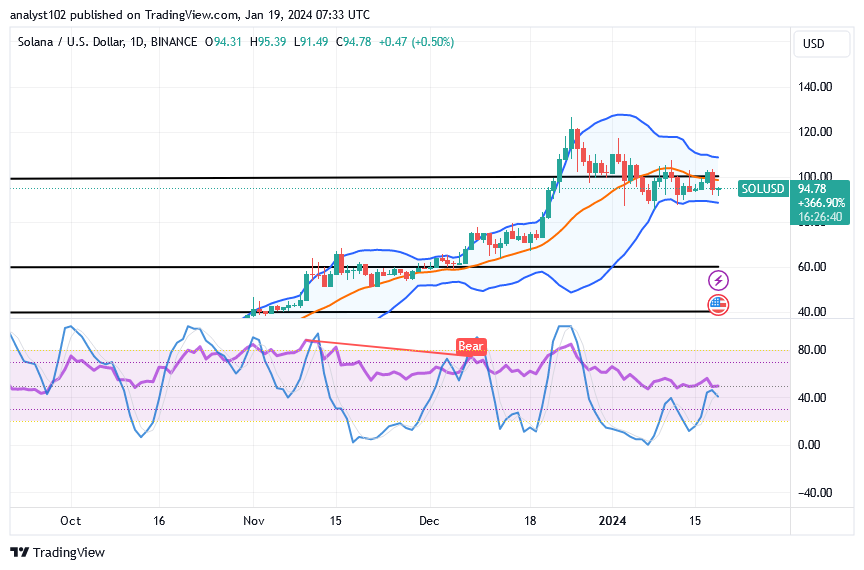
Will the SOL/USD market bears continue to decline further in the event of an unexpected break of the $80 line?
A fearful downward moving motion against the zone of $80 will in the subsequent operations let in more lows of variant lengths as the SOL/USD trade shows bottom shadows, creating a base.
A sequence of revolts and adverse pressures have been evident just below the $100 threshold. The Bollinger Bands are most likely going to maintain their small southward position in order to form a bullish flag pattern. The majority of longing entry points will be noted in the spirit of that assumption attempting to come true.
It is necessary to carefully reset any lost price momentum around the upper Bollinger Band trend line. Additionally, for the components to have the best chance of receiving great shorting entry, they must all be positioned somewhat southerly. As the price tends to restart its aggressively increasing powers, the $120 trade remains the crucial barrier line that needs to hold firm.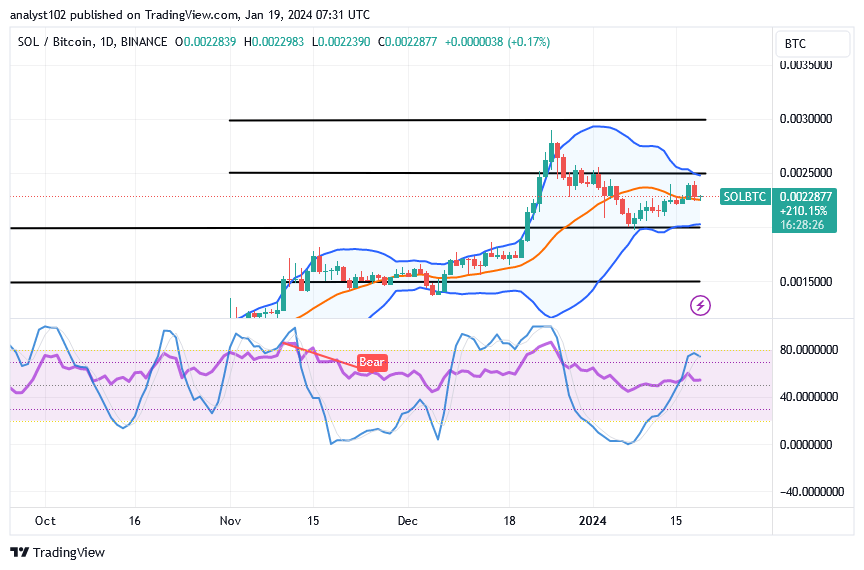
SOL/BTC Price Analysis
In contrast, Solana’s price has made efforts to surge against the valuation of Bitcoin, creating a base around the zone of the lower Bollinger Band.
The trend lines of the Bollinger Band have shifted upward, appearing at several locations to indicate a possible easterly position. It suggests that a few of the subsequent actions will definitely show up in the indicators. The stochastic oscillators are currently exhibiting a tendency to cross backward.
Note: Cryptosignals.org is not a financial advisor. Do your research before investing your funds in any financial asset or presented product or event. We are not responsible for your investing results.
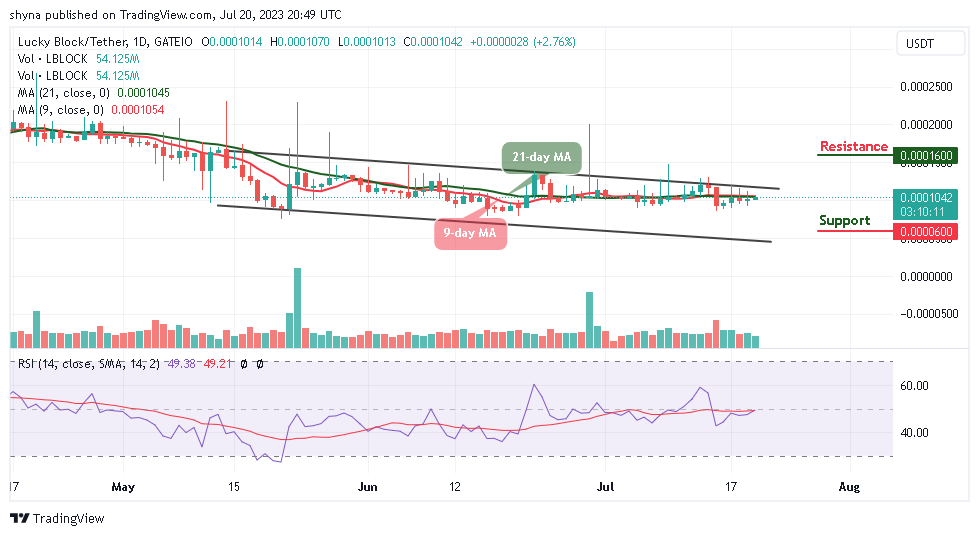
You can purchase Lucky Block here. Buy LBLOCK