Solana (SOL/USD) Prices Hold Rises, Breaking Variant Barriers
Estimated Reading Time: 3 minutes
Don’t invest unless you’re prepared to lose all the money you invest. This is a high-risk investment and you are unlikely to be protected if something goes wrong. Take 2 minutes to learn more
Solana Price Prediction – February 9
Most of the exchanging activities surfacing between the market operations of Solana and the market stances of the US Dollar have been that buyers are on top of the game, given that the trades hold rises, breaking variant barriers.
The final push northward by bulls, at the expense of bears’ incapacity to press violently against the $80 line, has resulted in a continual growing movement. As events are showing, investors and placers with long positions do not need to take a position against staged upsurges, particularly if the price does not typically set up a scenario for reversals.
SOL/USD Market
Key Levels:.
Resistance levels: $120, $130, $140
Support levels: $80, $75, $70
SOL/USD – Daily Chart
The SOL/USD daily chart reveals that the cryptocurrency market holds rises, breaking variant barriers via the upper Bollinger Band.
The stochastic oscillators have had a bent-back posture to the upside in the overbought region. The Bollinger Band trend lines have been steadily and slowly stretching northward on the upper side to align with the positive pace of the pairing instruments. The positive impulse on the candlesticks is liable to return to a decline trial, majorly below the point of $120.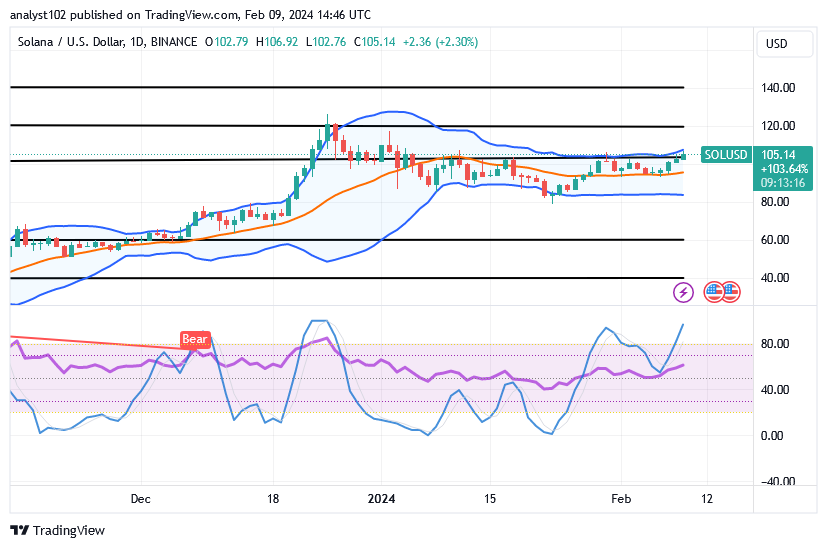
While the SOL/USD market oscillates around the upper Bollinger Band, is there a good opportunity to buy?
Long-position takers might be getting a rightful entry while the price makes active surges at a particular point in time, given that the SOL/USD market hold rises, breaking variant barriers.
Bollinger Band should be more forgiving of purchasers’ actions since the market’s increasing capacity has been steadily holding above its upper boundary. Put another way, purchasers may begin to heed warning signals to limit further appreciation at the point at which the indicator line begins to curve in deviation from the growing mode.
Before making a short entry, one should allow for a scenario of rejections somewhat above or near the upper Bollinger Band trend line to watch when the price will react to an aggressive decline move. The best time to start taking a position in that direction will be when two or three bearish candlesticks emerge.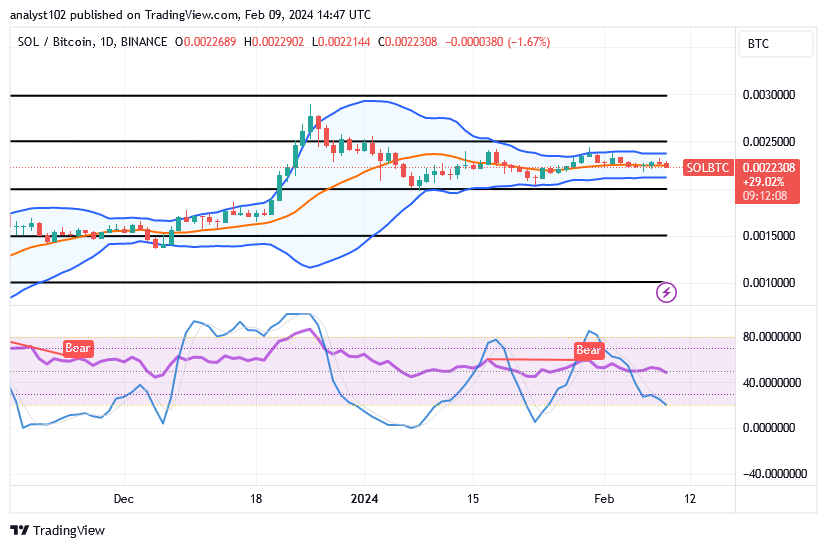
SOL/BTC Price Analysis
In contrast, the Solana market holds in the environments of the Bollinger Band indicators against the valuation of Bitcoin, as variant barriers are in the stake of braking soon.
The Bollinger Band trend lines indicate that buyers are still comparatively in the lead by pointing further easterly at higher points. The blue side of the stochastic oscillators has been adjusted lower to indicate that the base cryptocurrency is getting ready to gain ground against the counter-crypto economy. Anticipating a steady increase in lows could quickly result in whipsaw conditions.
Note: Cryptosignals.org is not a financial advisor. Do your research before investing your funds in any financial asset or presented product or event. We are not responsible for your investing results.
You can purchase Lucky Block here. Buy LBLOCK