Cardano Breaks Resistance at $0.55 as It Targets the $0.66 High
Estimated Reading Time: 2 minutes
Don’t invest unless you’re prepared to lose all the money you invest. This is a high-risk investment and you are unlikely to be protected if something goes wrong. Take 2 minutes to learn more

Free Crypto Signals Channel
Cardano (ADA) Long-Term Analysis: Bullish
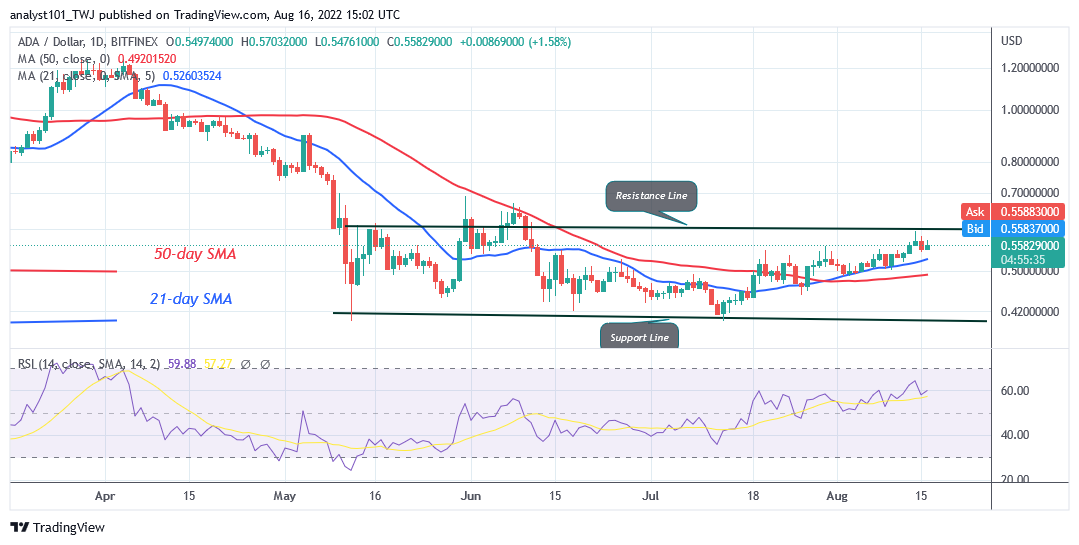
Cardano’s (ADA) price is in an upward correction as it targets the $0.66 high. The bulls broke the resistance at $0.55 to reach the recent high. After a pull back the uptrend is ongoing. On the upside, if the bulls breach $0.58 high, the market will rally to the high of $0.66 high. On the other hand, if the altcoin turns from the recent high, it will decline above the $0.50 support or the 21-day line SMA.
Cardano (ADA) Indicator Analysis
ADA is at level 59 of the Relative Strength Index for period 14. It indicates that ADA is trading in the bullish trend zone and may further rise. The 21-day line SMA and the 50-day line SMA are sloping upward indicating an uptrend. ADA is below the 40 % range of the daily stochastic. The market is in a bearish momentum.
Technical indicators:
Major supply zones: $2.0, $2.20, $2.40
Major demand zones: $1.40, $1.20, $1.00
What Is the Next Direction for Cardano (ADA)?
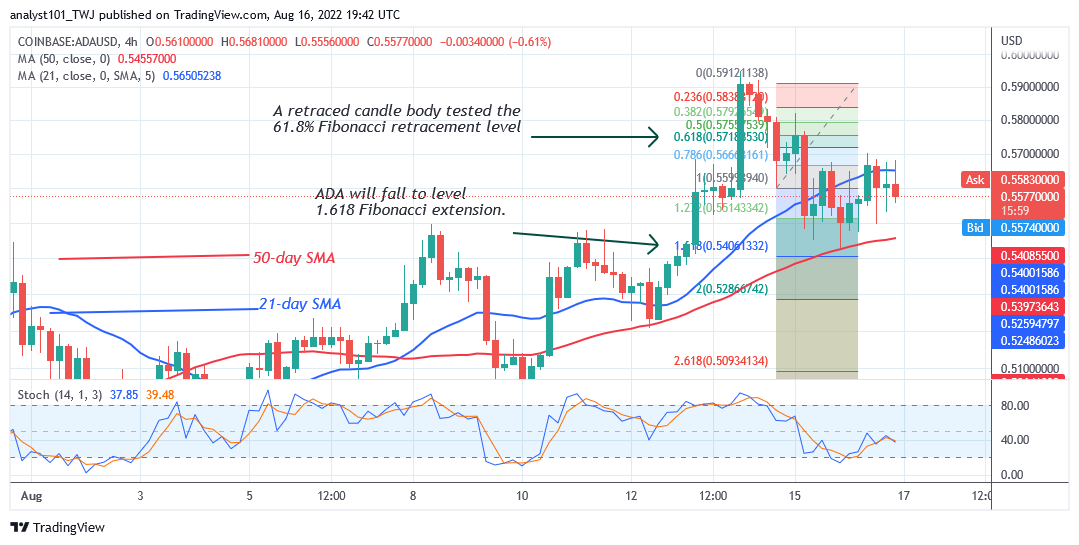
On the 4-hour chart, Cardano’s price is in a downtrend as it targets the $0.66 high. On August 14 downtrend, a retraced candle body tested the 61.8% Fibonacci retracement level. The retracement indicates that ADA will fall to level 1.618 Fibonacci extension or level $0.54. The selling pressure has subsided.
You can purchase crypto coins here. Buy LBLOCK
Note: Cryptosignals.org is not a financial advisor. Do your research before investing your funds in any financial asset or presented product or event. We are not responsible for your investing results


